Central Complex
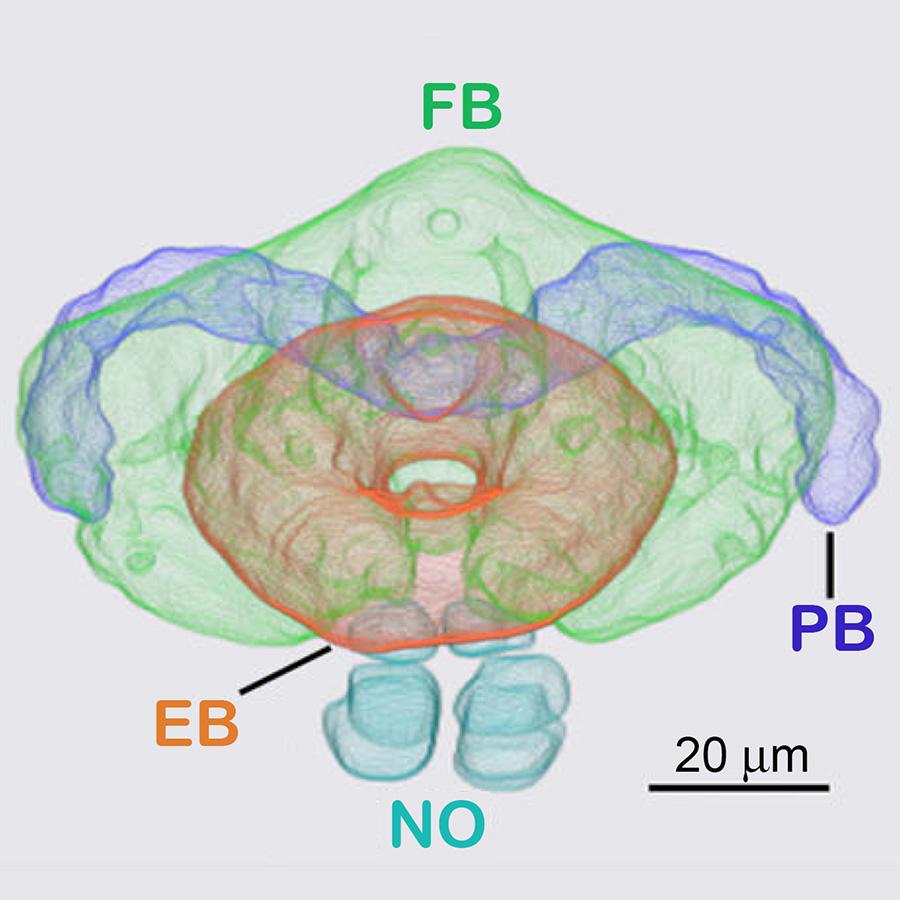
Diagram of the constituent neuropils of the central complex (see Wolff et al. 2014 for details).
Image (left) and schematic diagram (right) of a single neuron in the central complex (see Wolff et al. 2014 for details).
Examples of Ellipsoid Body (EB) ring neurons visualized using the MCFO method.
Individual neurons can be seen labeled in distinct colors.
Examples of EB ring neurons visualized using the MCFO method.
Individual neurons can be seen labeled in distinct colors.
Examples of EB neurons visualized using the MCFO method showing wedge arborization patterns within the EB.
Examples of Protocerebral Bridge (PB) neurons visualized using the MCFO method.
Examples of Fan-shaped Body (FB) neurons visualized using the MCFO method. Different cell types can be seen to arborize in different layers of the FB.
Examples of neurons that connect the PB, FB and noduli, visualized using the MCFO method.
(Left) Examples of neurons providing input to the PB from the inferior bridge and superior posterior slope, and (Right) neuronal arborizations in the noduli visualized using the MCFO method.
Characterization of a split-GAL4 line for a central complex cell-type providing input to the Protocerebral Bridge (PB) from the lateral accessory lobe and posterior slope. (Left) Two-color labeling with membrane and a synaptic markers reveals the polarity of the neurons. (Right) Morphology of single cells visualized using the MCFO method.
Characterization of a split-GAL4 line for a central complex cell-type sending output from the Protocerebral Bridge (PB) to the lateral accessory lobe and crepine. (Left) Two-color labeling with membrane and a synaptic markers reveals the polarity of the neurons. (Right) Morphology of single cells visualized using the MCFO method.


