Filter
Associated Lab
- Aguilera Castrejon Lab (17) Apply Aguilera Castrejon Lab filter
- Ahrens Lab (69) Apply Ahrens Lab filter
- Aso Lab (42) Apply Aso Lab filter
- Baker Lab (38) Apply Baker Lab filter
- Betzig Lab (115) Apply Betzig Lab filter
- Beyene Lab (14) Apply Beyene Lab filter
- Bock Lab (17) Apply Bock Lab filter
- Branson Lab (54) Apply Branson Lab filter
- Card Lab (43) Apply Card Lab filter
- Cardona Lab (64) Apply Cardona Lab filter
- Chklovskii Lab (13) Apply Chklovskii Lab filter
- Clapham Lab (15) Apply Clapham Lab filter
- Cui Lab (19) Apply Cui Lab filter
- Darshan Lab (12) Apply Darshan Lab filter
- Dennis Lab (2) Apply Dennis Lab filter
- Dickson Lab (46) Apply Dickson Lab filter
- Druckmann Lab (25) Apply Druckmann Lab filter
- Dudman Lab (53) Apply Dudman Lab filter
- Eddy/Rivas Lab (30) Apply Eddy/Rivas Lab filter
- Egnor Lab (11) Apply Egnor Lab filter
- Espinosa Medina Lab (21) Apply Espinosa Medina Lab filter
- Feliciano Lab (10) Apply Feliciano Lab filter
- Fetter Lab (41) Apply Fetter Lab filter
- FIB-SEM Technology (1) Apply FIB-SEM Technology filter
- Fitzgerald Lab (29) Apply Fitzgerald Lab filter
- Freeman Lab (15) Apply Freeman Lab filter
- Funke Lab (42) Apply Funke Lab filter
- Gonen Lab (91) Apply Gonen Lab filter
- Grigorieff Lab (62) Apply Grigorieff Lab filter
- Harris Lab (64) Apply Harris Lab filter
- Heberlein Lab (94) Apply Heberlein Lab filter
- Hermundstad Lab (30) Apply Hermundstad Lab filter
- Hess Lab (79) Apply Hess Lab filter
- Ilanges Lab (3) Apply Ilanges Lab filter
- Jayaraman Lab (48) Apply Jayaraman Lab filter
- Ji Lab (33) Apply Ji Lab filter
- Johnson Lab (6) Apply Johnson Lab filter
- Kainmueller Lab (19) Apply Kainmueller Lab filter
- Karpova Lab (14) Apply Karpova Lab filter
- Keleman Lab (13) Apply Keleman Lab filter
- Keller Lab (76) Apply Keller Lab filter
- Koay Lab (18) Apply Koay Lab filter
- Lavis Lab (154) Apply Lavis Lab filter
- Lee (Albert) Lab (34) Apply Lee (Albert) Lab filter
- Leonardo Lab (23) Apply Leonardo Lab filter
- Li Lab (30) Apply Li Lab filter
- Lippincott-Schwartz Lab (178) Apply Lippincott-Schwartz Lab filter
- Liu (Yin) Lab (7) Apply Liu (Yin) Lab filter
- Liu (Zhe) Lab (64) Apply Liu (Zhe) Lab filter
- Looger Lab (138) Apply Looger Lab filter
- Magee Lab (49) Apply Magee Lab filter
- Menon Lab (18) Apply Menon Lab filter
- Murphy Lab (13) Apply Murphy Lab filter
- O'Shea Lab (7) Apply O'Shea Lab filter
- Otopalik Lab (13) Apply Otopalik Lab filter
- Pachitariu Lab (49) Apply Pachitariu Lab filter
- Pastalkova Lab (18) Apply Pastalkova Lab filter
- Pavlopoulos Lab (19) Apply Pavlopoulos Lab filter
- Pedram Lab (15) Apply Pedram Lab filter
- Podgorski Lab (16) Apply Podgorski Lab filter
- Reiser Lab (54) Apply Reiser Lab filter
- Riddiford Lab (44) Apply Riddiford Lab filter
- Romani Lab (49) Apply Romani Lab filter
- Rubin Lab (148) Apply Rubin Lab filter
- Saalfeld Lab (64) Apply Saalfeld Lab filter
- Satou Lab (16) Apply Satou Lab filter
- Scheffer Lab (38) Apply Scheffer Lab filter
- Schreiter Lab (69) Apply Schreiter Lab filter
- Sgro Lab (21) Apply Sgro Lab filter
- Shroff Lab (31) Apply Shroff Lab filter
- Simpson Lab (23) Apply Simpson Lab filter
- Singer Lab (80) Apply Singer Lab filter
- Spruston Lab (97) Apply Spruston Lab filter
- Stern Lab (158) Apply Stern Lab filter
- Sternson Lab (54) Apply Sternson Lab filter
- Stringer Lab (39) Apply Stringer Lab filter
- Svoboda Lab (135) Apply Svoboda Lab filter
- Tebo Lab (35) Apply Tebo Lab filter
- Tervo Lab (9) Apply Tervo Lab filter
- Tillberg Lab (21) Apply Tillberg Lab filter
- Tjian Lab (64) Apply Tjian Lab filter
- Truman Lab (88) Apply Truman Lab filter
- Turaga Lab (53) Apply Turaga Lab filter
- Turner Lab (39) Apply Turner Lab filter
- Vale Lab (8) Apply Vale Lab filter
- Voigts Lab (4) Apply Voigts Lab filter
- Wang (Meng) Lab (27) Apply Wang (Meng) Lab filter
- Wang (Shaohe) Lab (25) Apply Wang (Shaohe) Lab filter
- Wu Lab (9) Apply Wu Lab filter
- Zlatic Lab (28) Apply Zlatic Lab filter
- Zuker Lab (25) Apply Zuker Lab filter
Associated Project Team
- CellMap (12) Apply CellMap filter
- COSEM (3) Apply COSEM filter
- FIB-SEM Technology (5) Apply FIB-SEM Technology filter
- Fly Descending Interneuron (12) Apply Fly Descending Interneuron filter
- Fly Functional Connectome (14) Apply Fly Functional Connectome filter
- Fly Olympiad (5) Apply Fly Olympiad filter
- FlyEM (56) Apply FlyEM filter
- FlyLight (50) Apply FlyLight filter
- GENIE (47) Apply GENIE filter
- Integrative Imaging (7) Apply Integrative Imaging filter
- Larval Olympiad (2) Apply Larval Olympiad filter
- MouseLight (18) Apply MouseLight filter
- NeuroSeq (1) Apply NeuroSeq filter
- ThalamoSeq (1) Apply ThalamoSeq filter
- Tool Translation Team (T3) (28) Apply Tool Translation Team (T3) filter
- Transcription Imaging (49) Apply Transcription Imaging filter
Publication Date
- 2025 (227) Apply 2025 filter
- 2024 (212) Apply 2024 filter
- 2023 (158) Apply 2023 filter
- 2022 (192) Apply 2022 filter
- 2021 (194) Apply 2021 filter
- 2020 (196) Apply 2020 filter
- 2019 (202) Apply 2019 filter
- 2018 (232) Apply 2018 filter
- 2017 (217) Apply 2017 filter
- 2016 (209) Apply 2016 filter
- 2015 (252) Apply 2015 filter
- 2014 (236) Apply 2014 filter
- 2013 (194) Apply 2013 filter
- 2012 (190) Apply 2012 filter
- 2011 (190) Apply 2011 filter
- 2010 (161) Apply 2010 filter
- 2009 (158) Apply 2009 filter
- 2008 (140) Apply 2008 filter
- 2007 (106) Apply 2007 filter
- 2006 (92) Apply 2006 filter
- 2005 (67) Apply 2005 filter
- 2004 (57) Apply 2004 filter
- 2003 (58) Apply 2003 filter
- 2002 (39) Apply 2002 filter
- 2001 (28) Apply 2001 filter
- 2000 (29) Apply 2000 filter
- 1999 (14) Apply 1999 filter
- 1998 (18) Apply 1998 filter
- 1997 (16) Apply 1997 filter
- 1996 (10) Apply 1996 filter
- 1995 (18) Apply 1995 filter
- 1994 (12) Apply 1994 filter
- 1993 (10) Apply 1993 filter
- 1992 (6) Apply 1992 filter
- 1991 (11) Apply 1991 filter
- 1990 (11) Apply 1990 filter
- 1989 (6) Apply 1989 filter
- 1988 (1) Apply 1988 filter
- 1987 (7) Apply 1987 filter
- 1986 (4) Apply 1986 filter
- 1985 (5) Apply 1985 filter
- 1984 (2) Apply 1984 filter
- 1983 (2) Apply 1983 filter
- 1982 (3) Apply 1982 filter
- 1981 (3) Apply 1981 filter
- 1980 (1) Apply 1980 filter
- 1979 (1) Apply 1979 filter
- 1976 (2) Apply 1976 filter
- 1973 (1) Apply 1973 filter
- 1970 (1) Apply 1970 filter
- 1967 (1) Apply 1967 filter
Type of Publication
4202 Publications
Showing 501-510 of 4202 resultsRegulation of transcription during embryogenesis is key to development and differentiation. To study transcript expression throughout Caenorhabditis elegans embryogenesis at single-molecule resolution, we developed a high-throughput single-molecule fluorescence in situ hybridization (smFISH) method that relies on computational methods to developmentally stage embryos and quantify individual mRNA molecules in single embryos. We applied our system to sdc-2, a zygotically transcribed gene essential for hermaphrodite development and dosage compensation. We found that sdc-2 is rapidly activated during early embryogenesis by increasing both the number of mRNAs produced per transcription site and the frequency of sites engaged in transcription. Knockdown of sdc-2 and dpy-27, a subunit of the dosage compensation complex (DCC), increased the number of active transcription sites for the X chromosomal gene dpy-23 but not the autosomal gene mdh-1, suggesting that the DCC reduces the frequency of dpy-23 transcription. The temporal resolution from in silico staging of embryos showed that the deletion of a single DCC recruitment element near the dpy-23 gene causes higher dpy-23 mRNA expression after the start of dosage compensation, which could not be resolved using mRNAseq from mixed-stage embryos. In summary, we have established a computational approach to quantify temporal regulation of transcription throughout C. elegans embryogenesis and demonstrated its potential to provide new insights into developmental gene regulation.
Regulation of transcription during embryogenesis is key to development and differentiation. To study transcript expression throughout Caenorhabditis elegans embryogenesis at single-molecule resolution, we developed a high-throughput single-molecule fluorescence in situ hybridization (smFISH) method that relies on computational methods to developmentally stage embryos and quantify individual mRNA molecules in single embryos. We applied our system to sdc-2, a zygotically transcribed gene essential for hermaphrodite development and dosage compensation. We found that sdc-2 is rapidly activated during early embryogenesis by increasing both the number of mRNAs produced per transcription site and the frequency of sites engaged in transcription. Knockdown of sdc-2 and dpy-27, a subunit of the dosage compensation complex (DCC), increased the number of active transcription sites for the X chromosomal gene dpy-23 but not the autosomal gene mdh-1, suggesting that the DCC reduces the frequency of dpy-23 transcription. The temporal resolution from in silico staging of embryos showed that the deletion of a single DCC recruitment element near the dpy-23 gene causes higher dpy-23 mRNA expression after the start of dosage compensation, which could not be resolved using mRNAseq from mixed-stage embryos. In summary, we have established a computational approach to quantify temporal regulation of transcription throughout C. elegans embryogenesis and demonstrated its potential to provide new insights into developmental gene regulation.Competing Interest StatementThe authors have declared no competing interest.
Single-particle electron cryo-microscopy and computational image classification can be used to analyze structural variability in macromolecules and their assemblies. In some cases, a particle may contain different regions that each display a range of distinct conformations. We have developed strategies, implemented within the Frealign and cisTEM image processing packages, to focus classify on specific regions of a particle and detect potential covariance. The strategies are based on masking the region of interest using either a 2-D mask applied to reference projections and particle images, or a 3-D mask applied to the 3-D volume. We show that focused classification approaches can be used to study structural covariance, a concept that is likely to gain more importance as datasets grow in size, allowing the distinction of more structural states and smaller differences between states. Finally, we apply the approaches to an experimental dataset containing the HIV-1 Transactivation Response (TAR) element RNA fused into the large bacterial ribosomal subunit to deconvolve structural mobility within localized regions of interest, and to a dataset containing assembly intermediates of the large subunit to measure structural covariance.
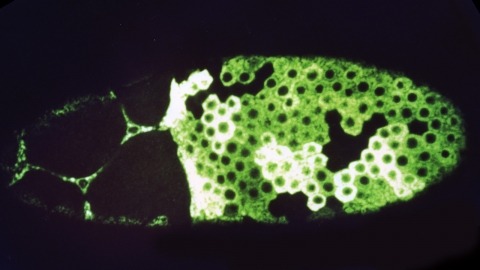
We have constructed a series of strains to facilitate the generation and analysis of clones of genetically distinct cells in developing and adult tissues of Drosophila. Each of these strains carries an FRT element, the target for the yeast FLP recombinase, near the base of a major chromosome arm, as well as a gratuitous cell-autonomous marker. Novel markers that carry epitope tags and that are localized to either the cell nucleus or cell membrane have been generated. As a demonstration of how these strains can be used to study a particular gene, we have analyzed the developmental role of the Drosophila EGF receptor homolog. Moreover, we have shown that these strains can be utilized to identify new mutations in mosaic animals in an efficient and unbiased way, thereby providing an unprecedented opportunity to perform systematic genetic screens for mutations affecting many biological processes.
Micro-crystal electron diffraction (MicroED) combines the efficiency of electron scattering with diffraction to allow structure determination from nano-sized crystalline samples in cryoelectron microscopy (cryo-EM). It has been used to solve structures of a diverse set of biomolecules and materials, in some cases to sub-atomic resolution. However, little is known about the damaging effects of the electron beam on samples during such measurements. We assess global and site-specific damage from electron radiation on nanocrystals of proteinase K and of a prion hepta-peptide and find that the dynamics of electron-induced damage follow well-established trends observed in X-ray crystallography. Metal ions are perturbed, disulfide bonds are broken, and acidic side chains are decarboxylated while the diffracted intensities decay exponentially with increasing exposure. A better understanding of radiation damage in MicroED improves our assessment and processing of all types of cryo-EM data.
The ability of fluorescence microscopy to simultaneously image multiple specific molecules of interest has allowed biologists to infer macromolecular organization and colocalization in fixed and live samples. However, a number of factors could affect these analyses, and colocalization is a misnomer. We propose that image similarity coefficient as a better and more descriptive term. In this chapter we will discuss many of the factors involved with determining image similarity including our perception of color in images. In addition, the correct use of several commonly accepted methods such as Pearson’s correlation coefficient, Manders’ overlap coefficient, and Spearman’s ranked correlation coefficient is discussed.
Chromosome inversions are of unique importance in the evolution of genomes and species because when heterozygous with a standard arrangement chromosome, they suppress meiotic crossovers within the inversion. In Drosophila species, heterozygous inversions also cause the interchromosomal effect, whereby the presence of a heterozygous inversion induces a dramatic increase in crossover frequencies in the remainder of the genome within a single meiosis. To date, the interchromosomal effect has been studied exclusively in species that also have high frequencies of inversions in wild populations. We took advantage of a recently developed approach for generating inversions in Drosophila simulans, a species that does not have inversions in wild populations, to ask if there is an interchromosomal effect. We used the existing chromosome 3R balancer and generated a new chromosome 2L balancer to assay for the interchromosomal effect genetically and cytologically. We found no evidence of an interchromosomal effect in D. simulans. To gain insight into the underlying mechanistic reasons, we qualitatively analyzed the relationship between meiotic double-strand break formation and synaptonemal complex assembly. We find that the synaptonemal complex is assembled prior to double-strand break formation as in D. melanogaster; however, we show that the synaptonemal complex is assembled prior to localization of the oocyte determination factor Orb, whereas in D. melanogaster, synaptonemal complex formation does not begin until Orb is localized. Together, our data show heterozygous inversions in D. simulans do not induce an interchromosomal effect and that there are differences in the developmental programming of the early stages of meiosis.
Mitochondria are organelles that have been primarily known as the powerhouse of the cell. However, recent advances in the field have revealed that mitochondria are also involved in many other cellular activities like lipid modifications, redox balance, calcium balance, and even controlled cell death. These multifunctional organelles are motile and highly dynamic in shapes and forms; the dynamism is brought about by the mitochondria's ability to undergo fission and fusion with each other. Therefore, it is very important to be able to image mitochondrial shape changes to relate to the variety of cellular functions these organelles have to accomplish. The protocols described here will enable researchers to perform steady-state and time-lapse imaging of mitochondria in live cells by using confocal microscopy. High-resolution three-dimensional imaging of mitochondria will not only be helpful in understanding mitochondrial structure in detail but it also could be used to analyze their structural relationships with other organelles in the cell. FRAP (fluorescence recovery after photobleaching) studies can be performed to understand mitochondrial dynamics or dynamics of any mitochondrial molecule within the organelle. The microirradiation assay can be performed to study functional continuity between mitochondria. A protocol for measuring mitochondrial potential has also been included in this unit. In conclusion, the protocols described here will aid the understanding of mitochondrial structure-function relationship.
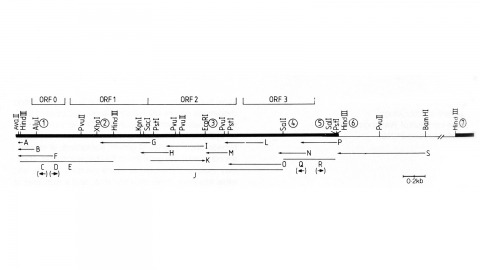
We have made a P-element derivative called Pc[ry], which carries the selectable marker gene rosy, but which acts like a nondefective, intact P element. It transposes autonomously into the germline chromosomes of an M-strain Drosophila embryo and it mobilizes in trans the defective P elements of the singed-weak allele. Frameshift mutations introduced into any of the four major open reading frames of the P sequence were each sufficient to eliminate the transposase activity, but none affected signals required in cis for transposition of the element. Complementation tests between pairs of mutant elements suggest that a single polypeptide comprises the transposase. We have examined transcripts of P elements both from natural P strains and from lines containing only nondefective Pc[ry] elements, and have identified two RNA species that appear to be specific for autonomous elements.
Phosphatidylinositol (PI) is an inositol-containing phospholipid synthesized in the endoplasmic reticulum (ER). PI is a precursor lipid for PI 4,5-bisphosphate (PI(4,5)P) in the plasma membrane (PM) important for Ca signaling in response to extracellular stimuli. Thus, ER-to-PM PI transfer becomes essential for cells to maintain PI(4,5)P homeostasis during receptor stimulation. In this chapter, we discuss two live-cell imaging protocols to analyze ER-to-PM PI transfer at ER-PM junctions, where the two membrane compartments make close appositions accommodating PI transfer. First, we describe how to monitor PI(4,5)P replenishment following receptor stimulation, as a readout of PI transfer, using a PI(4,5)P biosensor and total internal reflection fluorescence microscopy. The second protocol directly visualizes PI transfer proteins that accumulate at ER-PM junctions and mediate PI(4,5)P replenishment with PI in the ER in stimulated cells. These methods provide spatial and temporal analysis of ER-to-PM PI transfer during receptor stimulation and can be adapted to other research questions related to this topic.