Filter
Associated Lab
- Aguilera Castrejon Lab (19) Apply Aguilera Castrejon Lab filter
- Ahrens Lab (73) Apply Ahrens Lab filter
- Aso Lab (42) Apply Aso Lab filter
- Baker Lab (38) Apply Baker Lab filter
- Betzig Lab (116) Apply Betzig Lab filter
- Beyene Lab (15) Apply Beyene Lab filter
- Bock Lab (17) Apply Bock Lab filter
- Branson Lab (55) Apply Branson Lab filter
- Card Lab (43) Apply Card Lab filter
- Cardona Lab (64) Apply Cardona Lab filter
- Chklovskii Lab (13) Apply Chklovskii Lab filter
- Clapham Lab (16) Apply Clapham Lab filter
- Cui Lab (19) Apply Cui Lab filter
- Darshan Lab (12) Apply Darshan Lab filter
- Dennis Lab (3) Apply Dennis Lab filter
- Dickson Lab (46) Apply Dickson Lab filter
- Druckmann Lab (25) Apply Druckmann Lab filter
- Dudman Lab (56) Apply Dudman Lab filter
- Eddy/Rivas Lab (30) Apply Eddy/Rivas Lab filter
- Egnor Lab (11) Apply Egnor Lab filter
- Espinosa Medina Lab (23) Apply Espinosa Medina Lab filter
- Feliciano Lab (12) Apply Feliciano Lab filter
- Fetter Lab (41) Apply Fetter Lab filter
- FIB-SEM Technology (1) Apply FIB-SEM Technology filter
- Fitzgerald Lab (30) Apply Fitzgerald Lab filter
- Freeman Lab (15) Apply Freeman Lab filter
- Funke Lab (46) Apply Funke Lab filter
- Gonen Lab (91) Apply Gonen Lab filter
- Grigorieff Lab (62) Apply Grigorieff Lab filter
- Harris Lab (65) Apply Harris Lab filter
- Heberlein Lab (94) Apply Heberlein Lab filter
- Hermundstad Lab (30) Apply Hermundstad Lab filter
- Hess Lab (80) Apply Hess Lab filter
- Ilanges Lab (4) Apply Ilanges Lab filter
- Jayaraman Lab (48) Apply Jayaraman Lab filter
- Ji Lab (33) Apply Ji Lab filter
- Johnson Lab (6) Apply Johnson Lab filter
- Kainmueller Lab (19) Apply Kainmueller Lab filter
- Karpova Lab (15) Apply Karpova Lab filter
- Keleman Lab (13) Apply Keleman Lab filter
- Keller Lab (76) Apply Keller Lab filter
- Koay Lab (20) Apply Koay Lab filter
- Lavis Lab (158) Apply Lavis Lab filter
- Lee (Albert) Lab (34) Apply Lee (Albert) Lab filter
- Leonardo Lab (23) Apply Leonardo Lab filter
- Li Lab (32) Apply Li Lab filter
- Lippincott-Schwartz Lab (180) Apply Lippincott-Schwartz Lab filter
- Liu (Yin) Lab (8) Apply Liu (Yin) Lab filter
- Liu (Zhe) Lab (65) Apply Liu (Zhe) Lab filter
- Looger Lab (138) Apply Looger Lab filter
- Magee Lab (49) Apply Magee Lab filter
- Menon Lab (18) Apply Menon Lab filter
- Murphy Lab (13) Apply Murphy Lab filter
- O'Shea Lab (8) Apply O'Shea Lab filter
- Otopalik Lab (13) Apply Otopalik Lab filter
- Pachitariu Lab (54) Apply Pachitariu Lab filter
- Pastalkova Lab (19) Apply Pastalkova Lab filter
- Pavlopoulos Lab (19) Apply Pavlopoulos Lab filter
- Pedram Lab (15) Apply Pedram Lab filter
- Podgorski Lab (16) Apply Podgorski Lab filter
- Reiser Lab (55) Apply Reiser Lab filter
- Riddiford Lab (44) Apply Riddiford Lab filter
- Romani Lab (51) Apply Romani Lab filter
- Rubin Lab (149) Apply Rubin Lab filter
- Saalfeld Lab (64) Apply Saalfeld Lab filter
- Satou Lab (18) Apply Satou Lab filter
- Scheffer Lab (38) Apply Scheffer Lab filter
- Schreiter Lab (70) Apply Schreiter Lab filter
- Schulze Lab (1) Apply Schulze Lab filter
- Sgro Lab (23) Apply Sgro Lab filter
- Shroff Lab (31) Apply Shroff Lab filter
- Simpson Lab (23) Apply Simpson Lab filter
- Singer Lab (80) Apply Singer Lab filter
- Spruston Lab (98) Apply Spruston Lab filter
- Stern Lab (160) Apply Stern Lab filter
- Sternson Lab (54) Apply Sternson Lab filter
- Stringer Lab (43) Apply Stringer Lab filter
- Svoboda Lab (136) Apply Svoboda Lab filter
- Tebo Lab (35) Apply Tebo Lab filter
- Tervo Lab (10) Apply Tervo Lab filter
- Tillberg Lab (22) Apply Tillberg Lab filter
- Tjian Lab (64) Apply Tjian Lab filter
- Truman Lab (88) Apply Truman Lab filter
- Turaga Lab (53) Apply Turaga Lab filter
- Turner Lab (38) Apply Turner Lab filter
- Vale Lab (8) Apply Vale Lab filter
- Voigts Lab (4) Apply Voigts Lab filter
- Wang (Meng) Lab (29) Apply Wang (Meng) Lab filter
- Wang (Shaohe) Lab (25) Apply Wang (Shaohe) Lab filter
- Wong-Campos Lab (1) Apply Wong-Campos Lab filter
- Wu Lab (9) Apply Wu Lab filter
- Zlatic Lab (28) Apply Zlatic Lab filter
- Zuker Lab (25) Apply Zuker Lab filter
Associated Project Team
- CellMap (13) Apply CellMap filter
- COSEM (3) Apply COSEM filter
- FIB-SEM Technology (5) Apply FIB-SEM Technology filter
- Fly Descending Interneuron (12) Apply Fly Descending Interneuron filter
- Fly Functional Connectome (14) Apply Fly Functional Connectome filter
- Fly Olympiad (5) Apply Fly Olympiad filter
- FlyEM (56) Apply FlyEM filter
- FlyLight (50) Apply FlyLight filter
- GENIE (47) Apply GENIE filter
- Integrative Imaging (9) Apply Integrative Imaging filter
- Larval Olympiad (2) Apply Larval Olympiad filter
- MouseLight (18) Apply MouseLight filter
- NeuroSeq (1) Apply NeuroSeq filter
- ThalamoSeq (1) Apply ThalamoSeq filter
- Tool Translation Team (T3) (29) Apply Tool Translation Team (T3) filter
- Transcription Imaging (49) Apply Transcription Imaging filter
Publication Date
- 2026 (74) Apply 2026 filter
- 2025 (222) Apply 2025 filter
- 2024 (210) Apply 2024 filter
- 2023 (158) Apply 2023 filter
- 2022 (192) Apply 2022 filter
- 2021 (194) Apply 2021 filter
- 2020 (196) Apply 2020 filter
- 2019 (202) Apply 2019 filter
- 2018 (232) Apply 2018 filter
- 2017 (217) Apply 2017 filter
- 2016 (209) Apply 2016 filter
- 2015 (252) Apply 2015 filter
- 2014 (236) Apply 2014 filter
- 2013 (194) Apply 2013 filter
- 2012 (190) Apply 2012 filter
- 2011 (190) Apply 2011 filter
- 2010 (161) Apply 2010 filter
- 2009 (158) Apply 2009 filter
- 2008 (140) Apply 2008 filter
- 2007 (106) Apply 2007 filter
- 2006 (92) Apply 2006 filter
- 2005 (67) Apply 2005 filter
- 2004 (57) Apply 2004 filter
- 2003 (58) Apply 2003 filter
- 2002 (39) Apply 2002 filter
- 2001 (28) Apply 2001 filter
- 2000 (29) Apply 2000 filter
- 1999 (14) Apply 1999 filter
- 1998 (18) Apply 1998 filter
- 1997 (16) Apply 1997 filter
- 1996 (10) Apply 1996 filter
- 1995 (18) Apply 1995 filter
- 1994 (12) Apply 1994 filter
- 1993 (10) Apply 1993 filter
- 1992 (6) Apply 1992 filter
- 1991 (11) Apply 1991 filter
- 1990 (11) Apply 1990 filter
- 1989 (6) Apply 1989 filter
- 1988 (1) Apply 1988 filter
- 1987 (7) Apply 1987 filter
- 1986 (4) Apply 1986 filter
- 1985 (5) Apply 1985 filter
- 1984 (2) Apply 1984 filter
- 1983 (2) Apply 1983 filter
- 1982 (3) Apply 1982 filter
- 1981 (3) Apply 1981 filter
- 1980 (1) Apply 1980 filter
- 1979 (1) Apply 1979 filter
- 1976 (2) Apply 1976 filter
- 1973 (1) Apply 1973 filter
- 1970 (1) Apply 1970 filter
- 1967 (1) Apply 1967 filter
Type of Publication
4269 Publications
Showing 1321-1330 of 4269 resultsThe diverse transcriptional mechanisms governing cellular differentiation and development of mammalian tissue remains poorly understood. Here we report that TAF7L, a paralogue of TFIID subunit TAF7, is enriched in adipocytes and white fat tissue (WAT) in mouse. Depletion of TAF7L reduced adipocyte-specific gene expression, compromised adipocyte differentiation, and WAT development as well. Ectopic expression of TAF7L in myoblasts reprograms these muscle precursors into adipocytes upon induction. Genome-wide mRNA-seq expression profiling and ChIP-seq binding studies confirmed that TAF7L is required for activating adipocyte-specific genes via a dual mechanism wherein it interacts with PPARγ at enhancers and TBP/Pol II at core promoters. In vitro binding studies confirmed that TAF7L forms complexes with both TBP and PPARγ. These findings suggest that TAF7L plays an integral role in adipocyte gene expression by targeting enhancers as a cofactor for PPARγ and promoters as a component of the core transcriptional machinery.DOI:http://dx.doi.org/10.7554/eLife.00170.001.
A key limitation for achieving deep imaging in biological structures lies in photon absorption and scattering leading to attenuation of fluorescence. In particular, neurotransmitter imaging is challenging in the biologically relevant context of the intact brain for which photons must traverse the cranium, skin, and bone. Thus, fluorescence imaging is limited to the surface cortical layers of the brain, only achievable with craniotomy. Herein, this study describes optimal excitation and emission wavelengths for through‐cranium imaging, and demonstrates that near‐infrared emissive nanosensors can be photoexcited using a two‐photon 1560 nm excitation source. Dopamine‐sensitive nanosensors can undergo two‐photon excitation, and provide chirality‐dependent responses selective for dopamine with fluorescent turn‐on responses varying between 20% and 350%. The two‐photon absorption cross‐section and quantum yield of dopamine nanosensors are further calculated, and a two‐photon power law relationship for the nanosensor excitation process is confirmed. Finally, the improved image quality of the nanosensors embedded 2‐mm‐deep into a brain‐mimetic tissue phantom is shown, whereby one‐photon excitation yields 42% scattering, in contrast to 4% scattering when the same object is imaged under two‐photon excitation. The approach overcomes traditional limitations in deep‐tissue fluorescence microscopy, and can enable neurotransmitter imaging in the biologically relevant milieu of the intact and living brain.
Most of the enteric nervous system derives from the “vagal” neural crest, lying at the level of somites 1–7, which invades the digestive tract rostro-caudally from the foregut to the hindgut. Little is known about the initial phase of this colonization, which brings enteric precursors into the foregut. Here we show that the “vagal crest” subsumes two populations of enteric precursors with contrasted origins, initial modes of migration, and destinations. Crest cells adjacent to somites 1 and 2 produce Schwann cell precursors that colonize the vagus nerve, which in turn guides them into the esophagus and stomach. Crest cells adjacent to somites 3–7 belong to the crest streams contributing to sympathetic chains: they migrate ventrally, seed the sympathetic chains, and colonize the entire digestive tract thence. Accordingly, enteric ganglia, like sympathetic ones, are atrophic when deprived of signaling through the tyrosine kinase receptor ErbB3, while half of the esophageal ganglia require, like parasympathetic ones, the nerve-associated form of the ErbB3 ligand, Neuregulin-1. These dependencies might bear relevance to Hirschsprung disease, with which alleles of Neuregulin-1 are associated.
Cortical cells integrate synaptic input from multiple sources, but how these different inputs are distributed across individual neurons is largely unknown. Differences in input might account for diverse responses in neighboring neurons during behavior. We present a strategy for comparing the strengths of multiple types of input onto the same neuron. We developed methods for independent dual-channel photostimulation of synaptic inputs using ChR2 together with ReaChR, a red-shifted channelrhodopsin. We used dual-channel photostimulation to probe convergence of sensory information in the mouse primary motor cortex. Input from somatosensory cortex and thalamus converges in individual neurons. Similarly, inputs from distinct somatotopic regions of the somatosensory cortex are integrated at the level of single motor cortex neurons. We next developed a ReaChR transgenic mouse under the control of both Flp- and Cre-recombinases that is an effective tool for circuit mapping. Our approach to dual-channel photostimulation enables quantitative comparison of the strengths of multiple pathways across all length scales of the brain.
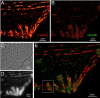
Accurate determination of the relative positions of proteins within localized regions of the cell is essential for understanding their biological function. Although fluorescent fusion proteins are targeted with molecular precision, the position of these genetically expressed reporters is usually known only to the resolution of conventional optics ( approximately 200 nm). Here, we report the use of two-color photoactivated localization microscopy (PALM) to determine the ultrastructural relationship between different proteins fused to spectrally distinct photoactivatable fluorescent proteins (PA-FPs). The nonperturbative incorporation of these endogenous tags facilitates an imaging resolution in whole, fixed cells of approximately 20-30 nm at acquisition times of 5-30 min. We apply the technique to image different pairs of proteins assembled in adhesion complexes, the central attachment points between the cytoskeleton and the substrate in migrating cells. For several pairs, we find that proteins that seem colocalized when viewed by conventional optics are resolved as distinct interlocking nano-aggregates when imaged via PALM. The simplicity, minimal invasiveness, resolution, and speed of the technique all suggest its potential to directly visualize molecular interactions within cellular structures at the nanometer scale.
Commentary: Identifies the photoactivatable fluorescent proteins (PA-FPs) Dronpa and PS-CFP2 as green partners to orange-red PA-FPs such as Kaede and Eos for dual color PALM imaging. Very low crosstalk is demonstrated between the two color channels. Furthermore, since the probes are genetically expressed, they are closely bound to their target proteins and exhibit zero non-specific background. All these properties are essential to unambiguously identify regions of co-localization or separate compartmentalization at the nanoscale, as demonstrated in the examples here.
3-photon excitation enables fluorescence microscopy deep in densely labeled and highly scattering samples. To date, 3-photon excitation has been restricted to scanning a single focus, limiting the speed of volume acquisition. Here, for the first time to our knowledge, we implemented and characterized dual-plane 3-photon microscopy with temporal multiplexing and remote focusing, and performed simultaneous calcium imaging of two planes beyond 600 µm deep in the cortex of a pan-excitatory GCaMP6s transgenic mouse with a per-plane framerate of 7 Hz and an effective 2 MHz laser repetition rate. This method is a straightforward and generalizable modification to single-focus 3PE systems, doubling the rate of volume (column) imaging with off-the-shelf components and minimal technical constraints.
Open-source software development has skyrocketed in part due to community tools like github.com, which allows publication of code as well as the ability to create branches and push accepted modifications back to the original repository. As the number and size of EM-based datasets increases, the connectomics community faces similar issues when we publish snapshot data corresponding to a publication. Ideally, there would be a mechanism where remote collaborators could modify branches of the data and then flexibly reintegrate results via moderated acceptance of changes. The DVID system provides a web-based connectomics API and the first steps toward such a distributed versioning approach to EM-based connectomics datasets. Through its use as the central data resource for Janelia's FlyEM team, we have integrated the concepts of distributed versioning into reconstruction workflows, allowing support for proofreader training and segmentation experiments through branched, versioned data. DVID also supports persistence to a variety of storage systems from high-speed local SSDs to cloud-based object stores, which allows its deployment on laptops as well as large servers. The tailoring of the backend storage to each type of connectomics data leads to efficient storage and fast queries. DVID is freely available as open-source software with an increasing number of supported storage options.
Eukaryotic gene expression is linked to chromatin structure and nucleosome positioning by ATP-dependent chromatin remodelers that establish and maintain nucleosome-depleted regions (NDRs) near transcription start sites. Conserved yeast RSC and ISW2 remodelers exert antagonistic effects on nucleosomes flanking NDRs, but the temporal dynamics of remodeler search, engagement, and directional nucleosome mobilization for promoter accessibility are unknown. Using optical tweezers and two-color single-particle imaging, we investigated the Brownian diffusion of RSC and ISW2 on free DNA and sparse nucleosome arrays. RSC and ISW2 rapidly scan DNA by one-dimensional hopping and sliding, respectively, with dynamic collisions between remodelers followed by recoil or apparent co-diffusion. Static nucleosomes block remodeler diffusion resulting in remodeler recoil or sequestration. Remarkably, both RSC and ISW2 use ATP hydrolysis to translocate mono-nucleosomes processively at ~30 bp/s on extended linear DNA under tension. Processivity and opposing push-pull directionalities of nucleosome translocation shown by RSC and ISW2 shape the distinctive landscape of promoter chromatin.
Brain oscillations are crucial for perception, memory, and behavior. Parvalbumin-expressing (PV) interneurons are critical for these oscillations, but their population dynamics remain unclear. Using voltage imaging, we simultaneously recorded membrane potentials in up to 26 PV interneurons in vivo during hippocampal ripple oscillations in mice. We found that PV cells generate ripple-frequency rhythms by forming highly dynamic cell assemblies. These assemblies exhibit rapid and significant changes from cycle to cycle, varying greatly in both size and membership. Importantly, this variability is not just random spiking failures of individual neurons. Rather, the activities of other PV cells contain significant information about whether a PV cell spikes or not in a given cycle. This coordination persists without network oscillations, and it exists in subthreshold potentials even when the cells are not spiking. Dynamic assemblies of interneurons may provide a new mechanism to modulate postsynaptic dynamics and impact cognitive functions flexibly and rapidly.
Clusters of time series data may change location and memberships over time; in gene expression data, this occurs as groups of genes or samples respond differently to stimuli or experimental conditions at different times. In order to uncover this underlying temporal structure, we consider dynamic clusters with time-dependent parameters which split and merge over time, enabling cluster memberships to change. These interesting time-dependent structures are useful in understanding the development of organisms or complex organs, and could not be identified using traditional clustering methods. In cell cycle data, these time-dependent structure may provide links between genes and stages of the cell cycle, whilst in developmental data sets they may highlight key developmental transitions.