Filter
Associated Lab
- Aguilera Castrejon Lab (19) Apply Aguilera Castrejon Lab filter
- Ahrens Lab (73) Apply Ahrens Lab filter
- Aso Lab (42) Apply Aso Lab filter
- Baker Lab (38) Apply Baker Lab filter
- Betzig Lab (116) Apply Betzig Lab filter
- Beyene Lab (15) Apply Beyene Lab filter
- Bock Lab (17) Apply Bock Lab filter
- Branson Lab (55) Apply Branson Lab filter
- Card Lab (43) Apply Card Lab filter
- Cardona Lab (64) Apply Cardona Lab filter
- Chklovskii Lab (13) Apply Chklovskii Lab filter
- Clapham Lab (16) Apply Clapham Lab filter
- Cui Lab (19) Apply Cui Lab filter
- Darshan Lab (12) Apply Darshan Lab filter
- Dennis Lab (3) Apply Dennis Lab filter
- Dickson Lab (46) Apply Dickson Lab filter
- Druckmann Lab (25) Apply Druckmann Lab filter
- Dudman Lab (56) Apply Dudman Lab filter
- Eddy/Rivas Lab (30) Apply Eddy/Rivas Lab filter
- Egnor Lab (11) Apply Egnor Lab filter
- Espinosa Medina Lab (24) Apply Espinosa Medina Lab filter
- Feliciano Lab (14) Apply Feliciano Lab filter
- Fetter Lab (41) Apply Fetter Lab filter
- FIB-SEM Technology (1) Apply FIB-SEM Technology filter
- Fitzgerald Lab (30) Apply Fitzgerald Lab filter
- Freeman Lab (15) Apply Freeman Lab filter
- Funke Lab (46) Apply Funke Lab filter
- Gonen Lab (91) Apply Gonen Lab filter
- Grigorieff Lab (62) Apply Grigorieff Lab filter
- Harris Lab (65) Apply Harris Lab filter
- Heberlein Lab (94) Apply Heberlein Lab filter
- Hermundstad Lab (30) Apply Hermundstad Lab filter
- Hess Lab (80) Apply Hess Lab filter
- Ilanges Lab (4) Apply Ilanges Lab filter
- Jayaraman Lab (48) Apply Jayaraman Lab filter
- Ji Lab (33) Apply Ji Lab filter
- Johnson Lab (7) Apply Johnson Lab filter
- Kainmueller Lab (19) Apply Kainmueller Lab filter
- Karpova Lab (15) Apply Karpova Lab filter
- Keleman Lab (13) Apply Keleman Lab filter
- Keller Lab (76) Apply Keller Lab filter
- Koay Lab (20) Apply Koay Lab filter
- Lavis Lab (159) Apply Lavis Lab filter
- Lee (Albert) Lab (34) Apply Lee (Albert) Lab filter
- Leonardo Lab (23) Apply Leonardo Lab filter
- Li Lab (32) Apply Li Lab filter
- Lippincott-Schwartz Lab (180) Apply Lippincott-Schwartz Lab filter
- Liu (Yin) Lab (8) Apply Liu (Yin) Lab filter
- Liu (Zhe) Lab (65) Apply Liu (Zhe) Lab filter
- Looger Lab (138) Apply Looger Lab filter
- Magee Lab (49) Apply Magee Lab filter
- Menon Lab (18) Apply Menon Lab filter
- Murphy Lab (13) Apply Murphy Lab filter
- O'Shea Lab (8) Apply O'Shea Lab filter
- Otopalik Lab (13) Apply Otopalik Lab filter
- Pachitariu Lab (54) Apply Pachitariu Lab filter
- Pastalkova Lab (19) Apply Pastalkova Lab filter
- Pavlopoulos Lab (19) Apply Pavlopoulos Lab filter
- Pedram Lab (15) Apply Pedram Lab filter
- Podgorski Lab (16) Apply Podgorski Lab filter
- Reiser Lab (55) Apply Reiser Lab filter
- Riddiford Lab (44) Apply Riddiford Lab filter
- Romani Lab (51) Apply Romani Lab filter
- Rubin Lab (149) Apply Rubin Lab filter
- Saalfeld Lab (64) Apply Saalfeld Lab filter
- Satou Lab (18) Apply Satou Lab filter
- Scheffer Lab (38) Apply Scheffer Lab filter
- Schreiter Lab (70) Apply Schreiter Lab filter
- Schulze Lab (1) Apply Schulze Lab filter
- Sgro Lab (23) Apply Sgro Lab filter
- Shroff Lab (31) Apply Shroff Lab filter
- Simpson Lab (23) Apply Simpson Lab filter
- Singer Lab (80) Apply Singer Lab filter
- Spruston Lab (98) Apply Spruston Lab filter
- Stern Lab (160) Apply Stern Lab filter
- Sternson Lab (54) Apply Sternson Lab filter
- Stringer Lab (43) Apply Stringer Lab filter
- Svoboda Lab (136) Apply Svoboda Lab filter
- Tebo Lab (36) Apply Tebo Lab filter
- Tervo Lab (10) Apply Tervo Lab filter
- Tillberg Lab (22) Apply Tillberg Lab filter
- Tjian Lab (64) Apply Tjian Lab filter
- Truman Lab (88) Apply Truman Lab filter
- Turaga Lab (53) Apply Turaga Lab filter
- Turner Lab (38) Apply Turner Lab filter
- Vale Lab (8) Apply Vale Lab filter
- Voigts Lab (5) Apply Voigts Lab filter
- Wang (Meng) Lab (29) Apply Wang (Meng) Lab filter
- Wang (Shaohe) Lab (25) Apply Wang (Shaohe) Lab filter
- Wong-Campos Lab (1) Apply Wong-Campos Lab filter
- Wu Lab (9) Apply Wu Lab filter
- Zlatic Lab (28) Apply Zlatic Lab filter
- Zuker Lab (25) Apply Zuker Lab filter
Associated Project Team
- CellMap (13) Apply CellMap filter
- COSEM (3) Apply COSEM filter
- FIB-SEM Technology (5) Apply FIB-SEM Technology filter
- Fly Descending Interneuron (12) Apply Fly Descending Interneuron filter
- Fly Functional Connectome (14) Apply Fly Functional Connectome filter
- Fly Olympiad (5) Apply Fly Olympiad filter
- FlyEM (56) Apply FlyEM filter
- FlyLight (50) Apply FlyLight filter
- GENIE (47) Apply GENIE filter
- Integrative Imaging (10) Apply Integrative Imaging filter
- Larval Olympiad (2) Apply Larval Olympiad filter
- MouseLight (18) Apply MouseLight filter
- NeuroSeq (1) Apply NeuroSeq filter
- ThalamoSeq (1) Apply ThalamoSeq filter
- Tool Translation Team (T3) (29) Apply Tool Translation Team (T3) filter
- Transcription Imaging (49) Apply Transcription Imaging filter
Publication Date
- 2026 (80) Apply 2026 filter
- 2025 (222) Apply 2025 filter
- 2024 (210) Apply 2024 filter
- 2023 (158) Apply 2023 filter
- 2022 (192) Apply 2022 filter
- 2021 (194) Apply 2021 filter
- 2020 (196) Apply 2020 filter
- 2019 (202) Apply 2019 filter
- 2018 (232) Apply 2018 filter
- 2017 (217) Apply 2017 filter
- 2016 (209) Apply 2016 filter
- 2015 (252) Apply 2015 filter
- 2014 (236) Apply 2014 filter
- 2013 (194) Apply 2013 filter
- 2012 (190) Apply 2012 filter
- 2011 (190) Apply 2011 filter
- 2010 (161) Apply 2010 filter
- 2009 (158) Apply 2009 filter
- 2008 (140) Apply 2008 filter
- 2007 (106) Apply 2007 filter
- 2006 (92) Apply 2006 filter
- 2005 (67) Apply 2005 filter
- 2004 (57) Apply 2004 filter
- 2003 (58) Apply 2003 filter
- 2002 (39) Apply 2002 filter
- 2001 (28) Apply 2001 filter
- 2000 (29) Apply 2000 filter
- 1999 (14) Apply 1999 filter
- 1998 (18) Apply 1998 filter
- 1997 (16) Apply 1997 filter
- 1996 (10) Apply 1996 filter
- 1995 (18) Apply 1995 filter
- 1994 (12) Apply 1994 filter
- 1993 (10) Apply 1993 filter
- 1992 (6) Apply 1992 filter
- 1991 (11) Apply 1991 filter
- 1990 (11) Apply 1990 filter
- 1989 (6) Apply 1989 filter
- 1988 (1) Apply 1988 filter
- 1987 (7) Apply 1987 filter
- 1986 (4) Apply 1986 filter
- 1985 (5) Apply 1985 filter
- 1984 (2) Apply 1984 filter
- 1983 (2) Apply 1983 filter
- 1982 (3) Apply 1982 filter
- 1981 (3) Apply 1981 filter
- 1980 (1) Apply 1980 filter
- 1979 (1) Apply 1979 filter
- 1976 (2) Apply 1976 filter
- 1973 (1) Apply 1973 filter
- 1970 (1) Apply 1970 filter
- 1967 (1) Apply 1967 filter
Type of Publication
4275 Publications
Showing 131-140 of 4275 resultsL-Lactate, traditionally considered a metabolic waste product, is increasingly recognized as an important intercellular energy currency in mammals. To enable investigations of the emerging roles of intercellular shuttling of L-lactate, we now report an intensiometric green fluorescent genetically encoded biosensor for extracellular L-lactate. This biosensor, designated eLACCO1.1, enables cellular resolution imaging of extracellular L-lactate in cultured mammalian cells and brain tissue.
Since the original identification of GFP from jellyfish and corals, the genetically encoded fluorescent proteins have become mainstream indicators for imaging. Functionally homologous candidates exist in more highly evolved bioluminescent invertebrates, including echinoderms. For example, in brittlestars, stimulus-evoked bioluminescence is transient, lasting seconds, and emanates from specialized cells (photocytes). Prior to light emission, we observe little or no green fluorescence. However, concurrent with light emission, an intense green, calcium-dependent fluorescence develops that persists indefinitely.
Current techniques for monitoring GABA (γ-aminobutyric acid), the primary inhibitory neurotransmitter in vertebrates, cannot follow transients in intact neural circuits. To develop a GABA sensor, we applied the design principles used to create the fluorescent glutamate receptor iGluSnFR. We used a protein derived from a previously unsequenced Pseudomonas fluorescens strain and performed structure-guided mutagenesis and library screening to obtain intensity-based GABA sensing fluorescence reporter (iGABASnFR) variants. iGABASnFR is genetically encoded, detects GABA release evoked by electric stimulation of afferent fibers in acute brain slices and produces readily detectable fluorescence increases in vivo in mice and zebrafish. We applied iGABASnFR to track mitochondrial GABA content and its modulation by an anticonvulsant, swimming-evoked, GABA-mediated transmission in zebrafish cerebellum, GABA release events during interictal spikes and seizures in awake mice, and found that GABA-mediated tone decreases during isoflurane anesthesia.
The activity of the ERK has complex spatial and temporal dynamics that are important for the specificity of downstream effects. However, current biochemical techniques do not allow for the measurement of ERK signaling with fine spatiotemporal resolution. We developed a genetically encoded, FRET-based sensor of ERK activity (the extracellular signal-regulated kinase activity reporter, EKAR), optimized for signal-to-noise ratio and fluorescence lifetime imaging. EKAR selectively and reversibly reported ERK activation in HEK293 cells after epidermal growth factor stimulation. EKAR signals were correlated with ERK phosphorylation, required ERK activity, and did not report the activities of JNK or p38. EKAR reported ERK activation in the dendrites and nucleus of hippocampal pyramidal neurons in brain slices after theta-burst stimuli or trains of back-propagating action potentials. EKAR therefore permits the measurement of spatiotemporal ERK signaling dynamics in living cells, including in neuronal compartments in intact tissues.
We report an intensiometric, near-infrared fluorescent, genetically encoded calcium ion (Ca) indicator (GECI) with excitation and emission maxima at 678 and 704 nm, respectively. This GECI, designated NIR-GECO1, enables imaging of Ca transients in cultured mammalian cells and brain tissue with sensitivity comparable to that of currently available visible-wavelength GECIs. We demonstrate that NIR-GECO1 opens up new vistas for multicolor Ca imaging in combination with other optogenetic indicators and actuators.
Adenosine 5' triphosphate (ATP) is a universal intracellular energy source and an evolutionarily ancient, ubiquitous extracellular signal in diverse species. Here, we report the generation and characterization of single-wavelength genetically encoded fluorescent sensors (iATPSnFRs) for imaging extracellular and cytosolic ATP from insertion of circularly permuted superfolder GFP into the epsilon subunit of FF-ATPase from Bacillus PS3. On the cell surface and within the cytosol, iATPSnFR responds to relevant ATP concentrations (30 μM to 3 mM) with fast increases in fluorescence. iATPSnFRs can be genetically targeted to specific cell types and sub-cellular compartments, imaged with standard light microscopes, do not respond to other nucleotides and nucleosides, and when fused with a red fluorescent protein function as ratiometric indicators. After careful consideration of their modest pH sensitivity, iATPSnFRs represent promising reagents for imaging ATP in the extracellular space and within cells during a variety of settings, and for further application-specific refinements.
We describe the generation of a family of high-signal-to-noise single-wavelength genetically encoded indicators for maltose. This was achieved by insertion of circularly permuted fluorescent proteins into a bacterial periplasmic binding protein (PBP), Escherichia coli maltodextrin-binding protein, resulting in a four-color family of maltose indicators. The sensors were iteratively optimized to have sufficient brightness and maltose-dependent fluorescence increases for imaging, under both one- and two-photon illumination. We demonstrate that maltose affinity of the sensors can be tuned in a fashion largely independent of the fluorescent readout mechanism. Using literature mutations, the binding specificity could be altered to moderate sucrose preference, but with a significant loss of affinity. We use the soluble sensors in individual E. coli bacteria to observe rapid maltose transport across the plasma membrane, and membrane fusion versions of the sensors on mammalian cells to visualize the addition of maltose to extracellular media. The PBP superfamily includes scaffolds specific for a number of analytes whose visualization would be critical to the reverse engineering of complex systems such as neural networks, biosynthetic pathways, and signal transduction cascades. We expect the methodology outlined here to be useful in the development of indicators for many such analytes.
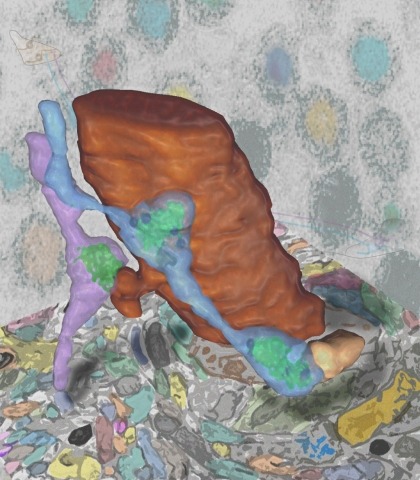
Synaptic connectivity and molecular composition provide a blueprint for information processing in neural circuits. Detailed structural analysis of neural circuits requires nanometer resolution, which can be obtained with serial-section electron microscopy. However, this technique remains challenging for reconstructing molecularly defined synapses. We used a genetically encoded synaptic marker for electron microscopy (GESEM) based on intra-vesicular generation of electron-dense labeling in axonal boutons. This approach allowed the identification of synapses from Cre recombinase-expressing or GAL4-expressing neurons in the mouse and fly with excellent preservation of ultrastructure. We applied this tool to visualize long-range connectivity of AGRP and POMC neurons in the mouse, two molecularly defined hypothalamic populations that are important for feeding behavior. Combining selective ultrastructural reconstruction of neuropil with functional and viral circuit mapping, we characterized some basic features of circuit organization for axon projections of these cell types. Our findings demonstrate that GESEM labeling enables long-range connectomics with molecularly defined cell types.
strain WP3 belongs to the group 1 branch of the genus and is a piezotolerant and psychrotolerant species isolated from the deep sea. In this study, a genome-scale model was constructed for WP3 using a combination of genome annotation, ortholog mapping, and physiological verification. The metabolic reconstruction contained 806 genes, 653 metabolites, and 922 reactions, including central metabolic functions that represented nonhomologous replacements between the group 1 and group 2 species. Metabolic simulations with the WP3 model demonstrated consistency with existing knowledge about the physiology of the organism. A comparison of model simulations with experimental measurements verified the predicted growth profiles under increasing concentrations of carbon sources. The WP3 model was applied to study mechanisms of anaerobic respiration through investigating energy conservation, redox balancing, and the generation of proton motive force. Despite being an obligate respiratory organism, WP3 was predicted to use substrate-level phosphorylation as the primary source of energy conservation under anaerobic conditions, a trait previously identified in other species. Further investigation of the ATP synthase activity revealed a positive correlation between the availability of reducing equivalents in the cell and the directionality of the ATP synthase reaction flux. Comparison of the WP3 model with an existing model of a group 2 species, MR-1, revealed that the WP3 model demonstrated greater flexibility in ATP production under the anaerobic conditions. Such flexibility could be advantageous to WP3 for its adaptation to fluctuating availability of organic carbon sources in the deep sea. The well-studied nature of the metabolic diversity of bacteria makes species from this genus a promising platform for investigating the evolution of carbon metabolism and energy conservation. The phylogeny is diverged into two major branches, referred to as group 1 and group 2. While the genotype-phenotype connections of group 2 species have been extensively studied with metabolic modeling, a genome-scale model has been missing for the group 1 species. The metabolic reconstruction of strain WP3 represented the first model for group 1 and the first model among piezotolerant and psychrotolerant deep-sea bacteria. The model brought insights into the mechanisms of energy conservation in WP3 under anaerobic conditions and highlighted its metabolic flexibility in using diverse carbon sources. Overall, the model opens up new opportunities for investigating energy conservation and metabolic adaptation, and it provides a prototype for systems-level modeling of other deep-sea microorganisms.
Forward genetic screens in model organisms have provided important insights into numerous aspects of development, physiology and pathology. With the availability of complete genome sequences and the introduction of RNA-mediated gene interference (RNAi), systematic reverse genetic screens are now also possible. Until now, such genome-wide RNAi screens have mostly been restricted to cultured cells and ubiquitous gene inactivation in Caenorhabditis elegans. This powerful approach has not yet been applied in a tissue-specific manner. Here we report the generation and validation of a genome-wide library of Drosophila melanogaster RNAi transgenes, enabling the conditional inactivation of gene function in specific tissues of the intact organism. Our RNAi transgenes consist of short gene fragments cloned as inverted repeats and expressed using the binary GAL4/UAS system. We generated 22,270 transgenic lines, covering 88% of the predicted protein-coding genes in the Drosophila genome. Molecular and phenotypic assays indicate that the majority of these transgenes are functional. Our transgenic RNAi library thus opens up the prospect of systematically analysing gene functions in any tissue and at any stage of the Drosophila lifespan.