Filter
Associated Lab
- Aguilera Castrejon Lab (15) Apply Aguilera Castrejon Lab filter
- Ahrens Lab (57) Apply Ahrens Lab filter
- Aso Lab (39) Apply Aso Lab filter
- Baker Lab (38) Apply Baker Lab filter
- Betzig Lab (111) Apply Betzig Lab filter
- Beyene Lab (10) Apply Beyene Lab filter
- Bock Lab (17) Apply Bock Lab filter
- Branson Lab (48) Apply Branson Lab filter
- Card Lab (40) Apply Card Lab filter
- Cardona Lab (63) Apply Cardona Lab filter
- Chklovskii Lab (13) Apply Chklovskii Lab filter
- Clapham Lab (13) Apply Clapham Lab filter
- Cui Lab (19) Apply Cui Lab filter
- Darshan Lab (12) Apply Darshan Lab filter
- Dennis Lab (1) Apply Dennis Lab filter
- Dickson Lab (46) Apply Dickson Lab filter
- Druckmann Lab (25) Apply Druckmann Lab filter
- Dudman Lab (46) Apply Dudman Lab filter
- Eddy/Rivas Lab (30) Apply Eddy/Rivas Lab filter
- Egnor Lab (11) Apply Egnor Lab filter
- Espinosa Medina Lab (16) Apply Espinosa Medina Lab filter
- Feliciano Lab (6) Apply Feliciano Lab filter
- Fetter Lab (41) Apply Fetter Lab filter
- Fitzgerald Lab (28) Apply Fitzgerald Lab filter
- Freeman Lab (15) Apply Freeman Lab filter
- Funke Lab (35) Apply Funke Lab filter
- Gonen Lab (91) Apply Gonen Lab filter
- Grigorieff Lab (62) Apply Grigorieff Lab filter
- Harris Lab (58) Apply Harris Lab filter
- Heberlein Lab (94) Apply Heberlein Lab filter
- Hermundstad Lab (22) Apply Hermundstad Lab filter
- Hess Lab (72) Apply Hess Lab filter
- Ilanges Lab (1) Apply Ilanges Lab filter
- Jayaraman Lab (44) Apply Jayaraman Lab filter
- Ji Lab (33) Apply Ji Lab filter
- Johnson Lab (6) Apply Johnson Lab filter
- Kainmueller Lab (19) Apply Kainmueller Lab filter
- Karpova Lab (14) Apply Karpova Lab filter
- Keleman Lab (13) Apply Keleman Lab filter
- Keller Lab (75) Apply Keller Lab filter
- Koay Lab (17) Apply Koay Lab filter
- Lavis Lab (138) Apply Lavis Lab filter
- Lee (Albert) Lab (34) Apply Lee (Albert) Lab filter
- Leonardo Lab (23) Apply Leonardo Lab filter
- Li Lab (27) Apply Li Lab filter
- Lippincott-Schwartz Lab (161) Apply Lippincott-Schwartz Lab filter
- Liu (Yin) Lab (5) Apply Liu (Yin) Lab filter
- Liu (Zhe) Lab (61) Apply Liu (Zhe) Lab filter
- Looger Lab (137) Apply Looger Lab filter
- Magee Lab (49) Apply Magee Lab filter
- Menon Lab (18) Apply Menon Lab filter
- Murphy Lab (13) Apply Murphy Lab filter
- O'Shea Lab (6) Apply O'Shea Lab filter
- Otopalik Lab (13) Apply Otopalik Lab filter
- Pachitariu Lab (42) Apply Pachitariu Lab filter
- Pastalkova Lab (18) Apply Pastalkova Lab filter
- Pavlopoulos Lab (19) Apply Pavlopoulos Lab filter
- Pedram Lab (14) Apply Pedram Lab filter
- Podgorski Lab (16) Apply Podgorski Lab filter
- Reiser Lab (49) Apply Reiser Lab filter
- Riddiford Lab (44) Apply Riddiford Lab filter
- Romani Lab (41) Apply Romani Lab filter
- Rubin Lab (139) Apply Rubin Lab filter
- Saalfeld Lab (61) Apply Saalfeld Lab filter
- Satou Lab (16) Apply Satou Lab filter
- Scheffer Lab (36) Apply Scheffer Lab filter
- Schreiter Lab (62) Apply Schreiter Lab filter
- Sgro Lab (20) Apply Sgro Lab filter
- Shroff Lab (24) Apply Shroff Lab filter
- Simpson Lab (23) Apply Simpson Lab filter
- Singer Lab (80) Apply Singer Lab filter
- Spruston Lab (91) Apply Spruston Lab filter
- Stern Lab (152) Apply Stern Lab filter
- Sternson Lab (54) Apply Sternson Lab filter
- Stringer Lab (29) Apply Stringer Lab filter
- Svoboda Lab (135) Apply Svoboda Lab filter
- Tebo Lab (31) Apply Tebo Lab filter
- Tervo Lab (9) Apply Tervo Lab filter
- Tillberg Lab (17) Apply Tillberg Lab filter
- Tjian Lab (64) Apply Tjian Lab filter
- Truman Lab (88) Apply Truman Lab filter
- Turaga Lab (46) Apply Turaga Lab filter
- Turner Lab (35) Apply Turner Lab filter
- Vale Lab (6) Apply Vale Lab filter
- Voigts Lab (2) Apply Voigts Lab filter
- Wang (Meng) Lab (10) Apply Wang (Meng) Lab filter
- Wang (Shaohe) Lab (24) Apply Wang (Shaohe) Lab filter
- Wu Lab (9) Apply Wu Lab filter
- Zlatic Lab (28) Apply Zlatic Lab filter
- Zuker Lab (25) Apply Zuker Lab filter
Associated Project Team
- CellMap (6) Apply CellMap filter
- COSEM (3) Apply COSEM filter
- Fly Descending Interneuron (10) Apply Fly Descending Interneuron filter
- Fly Functional Connectome (14) Apply Fly Functional Connectome filter
- Fly Olympiad (5) Apply Fly Olympiad filter
- FlyEM (51) Apply FlyEM filter
- FlyLight (46) Apply FlyLight filter
- GENIE (40) Apply GENIE filter
- Integrative Imaging (1) Apply Integrative Imaging filter
- Larval Olympiad (2) Apply Larval Olympiad filter
- MouseLight (16) Apply MouseLight filter
- NeuroSeq (1) Apply NeuroSeq filter
- ThalamoSeq (1) Apply ThalamoSeq filter
- Tool Translation Team (T3) (24) Apply Tool Translation Team (T3) filter
- Transcription Imaging (49) Apply Transcription Imaging filter
Publication Date
- 2024 (170) Apply 2024 filter
- 2023 (171) Apply 2023 filter
- 2022 (192) Apply 2022 filter
- 2021 (193) Apply 2021 filter
- 2020 (196) Apply 2020 filter
- 2019 (202) Apply 2019 filter
- 2018 (232) Apply 2018 filter
- 2017 (217) Apply 2017 filter
- 2016 (209) Apply 2016 filter
- 2015 (252) Apply 2015 filter
- 2014 (236) Apply 2014 filter
- 2013 (194) Apply 2013 filter
- 2012 (190) Apply 2012 filter
- 2011 (190) Apply 2011 filter
- 2010 (161) Apply 2010 filter
- 2009 (158) Apply 2009 filter
- 2008 (140) Apply 2008 filter
- 2007 (106) Apply 2007 filter
- 2006 (92) Apply 2006 filter
- 2005 (67) Apply 2005 filter
- 2004 (57) Apply 2004 filter
- 2003 (58) Apply 2003 filter
- 2002 (39) Apply 2002 filter
- 2001 (28) Apply 2001 filter
- 2000 (29) Apply 2000 filter
- 1999 (14) Apply 1999 filter
- 1998 (18) Apply 1998 filter
- 1997 (16) Apply 1997 filter
- 1996 (10) Apply 1996 filter
- 1995 (18) Apply 1995 filter
- 1994 (12) Apply 1994 filter
- 1993 (10) Apply 1993 filter
- 1992 (6) Apply 1992 filter
- 1991 (11) Apply 1991 filter
- 1990 (11) Apply 1990 filter
- 1989 (6) Apply 1989 filter
- 1988 (1) Apply 1988 filter
- 1987 (7) Apply 1987 filter
- 1986 (4) Apply 1986 filter
- 1985 (5) Apply 1985 filter
- 1984 (2) Apply 1984 filter
- 1983 (2) Apply 1983 filter
- 1982 (3) Apply 1982 filter
- 1981 (3) Apply 1981 filter
- 1980 (1) Apply 1980 filter
- 1979 (1) Apply 1979 filter
- 1976 (2) Apply 1976 filter
- 1973 (1) Apply 1973 filter
- 1970 (1) Apply 1970 filter
- 1967 (1) Apply 1967 filter
Type of Publication
3945 Publications
Showing 1761-1770 of 3945 resultsThis chapter describes many of the technologies, which have the potential to provide new insights into fundamental aspects of liver biology. Imaging live liver tissue in an animal with multiphoton microscopy coupled with photoactivatable fluorescent proteins and/or additional fluorescent proteins could be used to follow the lineage and fates of individual transplanted stem cells or developing transgenic cells in liver. Proteins or other molecules are labeled with a dye that can be excited with light source. Cells and proteins are generally too small to detect with the naked eye, relatively transparent when imaged by light microscopy, and are highly dynamic. With the increased signal to noise, isotropic and volumetric imaging and high speeds lattice light sheet allows for 3D super‐resolution microscopy, as well. Photomultiplier tubes, while capable of detecting and counting single photons, are less useful for high‐speed imaging because they normally only detect a single pixel at a time.
Many biomolecules in cells can be visualized with high sensitivity and specificity by fluorescence microscopy. However, the resolution of conventional light microscopy is limited by diffraction to ~200-250nm laterally and >500nm axially. Here, we describe superresolution methods based on single-molecule localization analysis of photoswitchable fluorophores (PALM: photoactivated localization microscopy) as well as our recent three-dimensional (3D) method (iPALM: interferometric PALM) that allows imaging with a resolution better than 20nm in all three dimensions. Considerations for their implementations, applications to multicolor imaging, and a recent development that extend the imaging depth of iPALM to ~750nm are discussed. As the spatial resolution of superresolution fluorescence microscopy converges with that of electron microscopy (EM), direct imaging of the same specimen using both approaches becomes feasible. This could be particularly useful for cross validation of experiments, and thus, we also describe recent methods that were developed for correlative superresolution fluorescence and EM.
Widefield imaging of calcium dynamics is an emerging method for mapping regional neural activity but is currently limited to restrained animals. Here we describe cScope, a head-mounted widefield macroscope developed to image large-scale cortical dynamics in rats during natural behavior. cScope provides a 7.8 × 4 mm field of view and dual illumination paths for both fluorescence and hemodynamic correction and can be fabricated at low cost using readily attainable components. We also report the development of Thy-1 transgenic rat strains with widespread neuronal expression of the calcium indicator GCaMP6f. We combined these two technologies to image large-scale calcium dynamics in the dorsal neocortex during a visual evidence accumulation task. Quantitative analysis of task-related dynamics revealed multiple regions having neural signals that encode behavioral choice and sensory evidence. Our results provide a new transgenic resource for calcium imaging in rats and extend the domain of head-mounted microscopes to larger-scale cortical dynamics.
Many eukaryotic transcription factors (TFs) contain intrinsically disordered low-complexity domains (LCDs), but how they drive transactivation remains unclear. Here, live-cell single-molecule imaging reveals that TF-LCDs form local high-concentration interaction hubs at synthetic and endogenous genomic loci. TF-LCD hubs stabilize DNA binding, recruit RNA polymerase II (Pol II), and activate transcription. LCD-LCD interactions within hubs are highly dynamic, display selectivity with binding partners, and are differentially sensitive to disruption by hexanediols. Under physiological conditions, rapid and reversible LCD-LCD interactions occur between TFs and the Pol II machinery without detectable phase separation. Our findings reveal fundamental mechanisms underpinning transcriptional control and suggest a framework for developing single-molecule imaging screens for novel drugs targeting gene regulatory interactions implicated in disease.

A custom-built objective lens called the Mesolens allows relatively large biological specimens to be imaged with cellular resolution.
We have established a preparation in larval Drosophila to monitor fictive locomotion simultaneously across abdominal and thoracic segments of the isolated CNS with genetically encoded Ca(2+) indicators. The Ca(2+) signals closely followed spiking activity measured electrophysiologically in nerve roots. Three motor patterns are analyzed. Two comprise waves of Ca(2+) signals that progress along the longitudinal body axis in a posterior-to-anterior or anterior-to-posterior direction. These waves had statistically indistinguishable intersegmental phase delays compared with segmental contractions during forward and backward crawling behavior, despite being ∼10 times slower. During these waves, motor neurons of the dorsal longitudinal and transverse muscles were active in the same order as the muscle groups are recruited during crawling behavior. A third fictive motor pattern exhibits a left-right asymmetry across segments and bears similarities with turning behavior in intact larvae, occurring equally frequently and involving asymmetry in the same segments. Ablation of the segments in which forward and backward waves of Ca(2+) signals were normally initiated did not eliminate production of Ca(2+) waves. When the brain and subesophageal ganglion (SOG) were removed, the remaining ganglia retained the ability to produce both forward and backward waves of motor activity, although the speed and frequency of waves changed. Bilateral asymmetry of activity was reduced when the brain was removed and abolished when the SOG was removed. This work paves the way to studying the neural and genetic underpinnings of segmentally coordinated motor pattern generation in Drosophila with imaging techniques.
Imaging informatics has emerged as a major research theme in biomedicine in the last few decades. Currently, personalised, predictive and preventive patient care is believed to be one of the top priorities in biomedical research and practice. Imaging informatics plays a major role in biomedicine studies. This paper reviews main applications and challenges of imaging informatics in biomedicine.
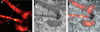
We introduce a method for optically imaging intracellular proteins at nanometer spatial resolution. Numerous sparse subsets of photoactivatable fluorescent protein molecules were activated, localized (to approximately 2 to 25 nanometers), and then bleached. The aggregate position information from all subsets was then assembled into a superresolution image. We used this method–termed photoactivated localization microscopy–to image specific target proteins in thin sections of lysosomes and mitochondria; in fixed whole cells, we imaged vinculin at focal adhesions, actin within a lamellipodium, and the distribution of the retroviral protein Gag at the plasma membrane.
Commentary: The original PALM paper by myself and my friend and co-inventor Harald Hess, spanning the before- and after-HHMI eras. Submitted and publicly presented months before other publications in the same year, the lessons of the paper remain widely misunderstood: 1) localization precision is not resolution; 2) the ability to resolve a few molecules by the Rayleigh criterion in a diffraction limited region (DLR) does not imply the ability to resolve structures of arbitrary complexity at the same scale; 3) true resolution well beyond the Abbe limit requires the ability to isolate and localize hundreds or thousands of molecules in one DLR; and 4) certain photoactivatable fluorescent proteins (PA-FPs) and caged dyes can be isolated and precisely localized at such densities; yielding true resolution down to 20 nm. The molecular densities we demonstrate (105 molecules/m2) are more than two orders of magnitude greater than in later papers that year (implying ten-fold better true resolution) – indeed, these papers demonstrate densities only comparable to earlier spectral or photobleaching based isolation methods. We validate our claims by correlative electron microscopy, and demonstrate the outstanding advantages of PA-FPs for superresolution microscopy: minimally perturbative sample preparation; high labeling densities; close binding to molecular targets; and zero non-specific background.
Decoding the wiring diagram of the retina requires simultaneous observation of activity in identified neuron populations. Available recording methods are limited in their scope: electrodes can access only a small fraction of neurons at once, whereas synthetic fluorescent indicator dyes label tissue indiscriminately. Here, we describe a method for studying retinal circuitry at cellular and subcellular levels combining two-photon microscopy and a genetically encoded calcium indicator. Using specific viral and promoter constructs to drive expression of GCaMP3, we labeled all five major neuron classes in the adult mouse retina. Stimulus-evoked GCaMP3 responses as imaged by two-photon microscopy permitted functional cell type annotation. Fluorescence responses were similar to those measured with the small molecule dye OGB-1. Fluorescence intensity correlated linearly with spike rates >10 spikes/s, and a significant change in fluorescence always reflected a significant change in spike firing rate. GCaMP3 expression had no apparent effect on neuronal function. Imaging at subcellular resolution showed compartment-specific calcium dynamics in multiple identified cell types.
Observation of molecular processes inside living cells is fundamental to a quantitative understanding of how biological systems function. Specifically, decoding the complex behavior of single molecules enables us to measure kinetics, transport, and self-assembly at this fundamental level that is often veiled in ensemble experiments. In the past decade, rapid developments in fluorescence microscopy, fluorescence correlation spectroscopy, and fluorescent labeling techniques have enabled new experiments to investigate the robustness and stochasticity of diverse molecular mechanisms with high spatiotemporal resolution. This review discusses the concepts and strategies of structural and functional imaging in living cells at the single-molecule level with minimal perturbations to the specimen.