Filter
Associated Lab
- Aguilera Castrejon Lab (19) Apply Aguilera Castrejon Lab filter
- Ahrens Lab (73) Apply Ahrens Lab filter
- Aso Lab (42) Apply Aso Lab filter
- Baker Lab (38) Apply Baker Lab filter
- Betzig Lab (116) Apply Betzig Lab filter
- Beyene Lab (15) Apply Beyene Lab filter
- Bock Lab (17) Apply Bock Lab filter
- Branson Lab (55) Apply Branson Lab filter
- Card Lab (43) Apply Card Lab filter
- Cardona Lab (64) Apply Cardona Lab filter
- Chklovskii Lab (13) Apply Chklovskii Lab filter
- Clapham Lab (16) Apply Clapham Lab filter
- Cui Lab (19) Apply Cui Lab filter
- Darshan Lab (12) Apply Darshan Lab filter
- Dennis Lab (3) Apply Dennis Lab filter
- Dickson Lab (46) Apply Dickson Lab filter
- Druckmann Lab (25) Apply Druckmann Lab filter
- Dudman Lab (56) Apply Dudman Lab filter
- Eddy/Rivas Lab (30) Apply Eddy/Rivas Lab filter
- Egnor Lab (11) Apply Egnor Lab filter
- Espinosa Medina Lab (23) Apply Espinosa Medina Lab filter
- Feliciano Lab (12) Apply Feliciano Lab filter
- Fetter Lab (41) Apply Fetter Lab filter
- FIB-SEM Technology (1) Apply FIB-SEM Technology filter
- Fitzgerald Lab (30) Apply Fitzgerald Lab filter
- Freeman Lab (15) Apply Freeman Lab filter
- Funke Lab (46) Apply Funke Lab filter
- Gonen Lab (91) Apply Gonen Lab filter
- Grigorieff Lab (62) Apply Grigorieff Lab filter
- Harris Lab (65) Apply Harris Lab filter
- Heberlein Lab (94) Apply Heberlein Lab filter
- Hermundstad Lab (30) Apply Hermundstad Lab filter
- Hess Lab (80) Apply Hess Lab filter
- Ilanges Lab (4) Apply Ilanges Lab filter
- Jayaraman Lab (48) Apply Jayaraman Lab filter
- Ji Lab (33) Apply Ji Lab filter
- Johnson Lab (6) Apply Johnson Lab filter
- Kainmueller Lab (19) Apply Kainmueller Lab filter
- Karpova Lab (14) Apply Karpova Lab filter
- Keleman Lab (13) Apply Keleman Lab filter
- Keller Lab (76) Apply Keller Lab filter
- Koay Lab (19) Apply Koay Lab filter
- Lavis Lab (158) Apply Lavis Lab filter
- Lee (Albert) Lab (34) Apply Lee (Albert) Lab filter
- Leonardo Lab (23) Apply Leonardo Lab filter
- Li Lab (32) Apply Li Lab filter
- Lippincott-Schwartz Lab (180) Apply Lippincott-Schwartz Lab filter
- Liu (Yin) Lab (8) Apply Liu (Yin) Lab filter
- Liu (Zhe) Lab (65) Apply Liu (Zhe) Lab filter
- Looger Lab (138) Apply Looger Lab filter
- Magee Lab (49) Apply Magee Lab filter
- Menon Lab (18) Apply Menon Lab filter
- Murphy Lab (13) Apply Murphy Lab filter
- O'Shea Lab (8) Apply O'Shea Lab filter
- Otopalik Lab (13) Apply Otopalik Lab filter
- Pachitariu Lab (52) Apply Pachitariu Lab filter
- Pastalkova Lab (19) Apply Pastalkova Lab filter
- Pavlopoulos Lab (19) Apply Pavlopoulos Lab filter
- Pedram Lab (15) Apply Pedram Lab filter
- Podgorski Lab (16) Apply Podgorski Lab filter
- Reiser Lab (55) Apply Reiser Lab filter
- Riddiford Lab (44) Apply Riddiford Lab filter
- Romani Lab (51) Apply Romani Lab filter
- Rubin Lab (149) Apply Rubin Lab filter
- Saalfeld Lab (64) Apply Saalfeld Lab filter
- Satou Lab (18) Apply Satou Lab filter
- Scheffer Lab (38) Apply Scheffer Lab filter
- Schreiter Lab (70) Apply Schreiter Lab filter
- Schulze Lab (1) Apply Schulze Lab filter
- Sgro Lab (23) Apply Sgro Lab filter
- Shroff Lab (31) Apply Shroff Lab filter
- Simpson Lab (23) Apply Simpson Lab filter
- Singer Lab (80) Apply Singer Lab filter
- Spruston Lab (98) Apply Spruston Lab filter
- Stern Lab (160) Apply Stern Lab filter
- Sternson Lab (54) Apply Sternson Lab filter
- Stringer Lab (41) Apply Stringer Lab filter
- Svoboda Lab (136) Apply Svoboda Lab filter
- Tebo Lab (35) Apply Tebo Lab filter
- Tervo Lab (9) Apply Tervo Lab filter
- Tillberg Lab (22) Apply Tillberg Lab filter
- Tjian Lab (64) Apply Tjian Lab filter
- Truman Lab (88) Apply Truman Lab filter
- Turaga Lab (53) Apply Turaga Lab filter
- Turner Lab (38) Apply Turner Lab filter
- Vale Lab (8) Apply Vale Lab filter
- Voigts Lab (4) Apply Voigts Lab filter
- Wang (Meng) Lab (29) Apply Wang (Meng) Lab filter
- Wang (Shaohe) Lab (25) Apply Wang (Shaohe) Lab filter
- Wong-Campos Lab (1) Apply Wong-Campos Lab filter
- Wu Lab (9) Apply Wu Lab filter
- Zlatic Lab (28) Apply Zlatic Lab filter
- Zuker Lab (25) Apply Zuker Lab filter
Associated Project Team
- CellMap (13) Apply CellMap filter
- COSEM (3) Apply COSEM filter
- FIB-SEM Technology (5) Apply FIB-SEM Technology filter
- Fly Descending Interneuron (12) Apply Fly Descending Interneuron filter
- Fly Functional Connectome (14) Apply Fly Functional Connectome filter
- Fly Olympiad (5) Apply Fly Olympiad filter
- FlyEM (56) Apply FlyEM filter
- FlyLight (50) Apply FlyLight filter
- GENIE (47) Apply GENIE filter
- Integrative Imaging (9) Apply Integrative Imaging filter
- Larval Olympiad (2) Apply Larval Olympiad filter
- MouseLight (18) Apply MouseLight filter
- NeuroSeq (1) Apply NeuroSeq filter
- ThalamoSeq (1) Apply ThalamoSeq filter
- Tool Translation Team (T3) (29) Apply Tool Translation Team (T3) filter
- Transcription Imaging (49) Apply Transcription Imaging filter
Publication Date
- 2026 (70) Apply 2026 filter
- 2025 (222) Apply 2025 filter
- 2024 (210) Apply 2024 filter
- 2023 (158) Apply 2023 filter
- 2022 (192) Apply 2022 filter
- 2021 (194) Apply 2021 filter
- 2020 (196) Apply 2020 filter
- 2019 (202) Apply 2019 filter
- 2018 (232) Apply 2018 filter
- 2017 (217) Apply 2017 filter
- 2016 (209) Apply 2016 filter
- 2015 (252) Apply 2015 filter
- 2014 (236) Apply 2014 filter
- 2013 (194) Apply 2013 filter
- 2012 (190) Apply 2012 filter
- 2011 (190) Apply 2011 filter
- 2010 (161) Apply 2010 filter
- 2009 (158) Apply 2009 filter
- 2008 (140) Apply 2008 filter
- 2007 (106) Apply 2007 filter
- 2006 (92) Apply 2006 filter
- 2005 (67) Apply 2005 filter
- 2004 (57) Apply 2004 filter
- 2003 (58) Apply 2003 filter
- 2002 (39) Apply 2002 filter
- 2001 (28) Apply 2001 filter
- 2000 (29) Apply 2000 filter
- 1999 (14) Apply 1999 filter
- 1998 (18) Apply 1998 filter
- 1997 (16) Apply 1997 filter
- 1996 (10) Apply 1996 filter
- 1995 (18) Apply 1995 filter
- 1994 (12) Apply 1994 filter
- 1993 (10) Apply 1993 filter
- 1992 (6) Apply 1992 filter
- 1991 (11) Apply 1991 filter
- 1990 (11) Apply 1990 filter
- 1989 (6) Apply 1989 filter
- 1988 (1) Apply 1988 filter
- 1987 (7) Apply 1987 filter
- 1986 (4) Apply 1986 filter
- 1985 (5) Apply 1985 filter
- 1984 (2) Apply 1984 filter
- 1983 (2) Apply 1983 filter
- 1982 (3) Apply 1982 filter
- 1981 (3) Apply 1981 filter
- 1980 (1) Apply 1980 filter
- 1979 (1) Apply 1979 filter
- 1976 (2) Apply 1976 filter
- 1973 (1) Apply 1973 filter
- 1970 (1) Apply 1970 filter
- 1967 (1) Apply 1967 filter
Type of Publication
4265 Publications
Showing 1801-1810 of 4265 resultsNeural damage is a devastating outcome of physical trauma. The glia are one of the main effectors of neuronal repair in the nervous system, but the dynamic interactions between peripheral neurons and Schwann cells during injury and regeneration remain incompletely characterized. Here, we combine laser microsurgery, genetic analysis, high-resolution intravital imaging and lattice light-sheet microscopy to study the interaction between Schwann cells and sensory neurons in a zebrafish model of neurotrauma. We found that chronic denervation by neuronal ablation leads to Schwann-cell death, whereas acute denervation by axonal severing does not affect the overall complexity and architecture of the glia. Neuronal-circuit regeneration begins when Schwann cells extend bridging processes to close the injury gap. Regenerating axons grow faster and directionally after the physiological clearing of distal debris by the Schwann cells. This might facilitate circuit repair by ensuring that axons are guided through unoccupied spaces within bands of Büngner towards their original peripheral target. Accordingly, in the absence of Schwann cells, regenerating axons are misrouted, impairing the re-innervation of sensory organs. Our results indicate that regenerating axons use haptotaxis as a directional cue during the reconstitution of a neural circuit. These findings have implications for therapies aimed at neurorepair, which will benefit from preserving the architecture of the peripheral glia during periods of denervation.
Microelectron diffraction (MicroED) is a new cryo-electron microscopy (cryo-EM) method capable of determining macromolecular structures at atomic resolution from vanishingly small 3D crystals. MicroED promises to solve atomic resolution structures from even the tiniest of crystals, less than a few hundred nanometers thick. MicroED complements frontier advances in crystallography and represents part of the rebirth of cryo-EM that is making macromolecular structure determination more accessible for all. Here we review the concept and practice of MicroED, for both the electron microscopist and crystallographer. Where other reviews have addressed specific details of the technique (Hattne et al., 2015, Shi et al., 2016 and Shi et al., 2013), we aim to provide context and highlight important features that should be considered when performing a MicroED experiment.
Identifying the genes underlying genetically complex traits is of fundamental importance for medicine, agriculture, and evolutionary biology. However, the level of resolution offered by traditional quantitative trait locus (QTL) mapping is usually coarse. We analyze here a trait closely related to fitness, ovariole number. Our initial interspecific mapping between Drosophila sechellia (8 ovarioles/ovary) and D. simulans (15 ovarioles/ovary) identified a major QTL on chromosome 3 and a minor QTL on chromosome 2. To refine the position of the major QTL, we selected 1038 additional recombinants in the region of interest using flanking morphological markers (selective phenotyping). This effort generated approximately one recombination event per gene and increased the mapping resolution by approximately seven times. Our study thus shows that using visible markers to select for recombinants can efficiently increase the resolution of QTL mapping. We resolved the major QTL into two epistatic QTL, QTL3a and QTL3b. QTL3a shows sign epistasis: it has opposite effects in two different genetic backgrounds, the presence vs. the absence of the QTL3b D. sechellia allele. This property of QTL3a allows us to reconstruct the probable order of fixation of the QTL alleles during evolution.
MicroED uses very small three-dimensional protein crystals and electron diffraction for structure determination. We present an improved data collection protocol for MicroED called 'continuous rotation'. Microcrystals are continuously rotated during data collection, yielding more accurate data. The method enables data processing with the crystallographic software tool MOSFLM, which resulted in improved resolution for the model protein lysozyme. These improvements are paving the way for the broad implementation and application of MicroED in structural biology.
In vivo direct conversion of differentiated cells holds promise for regenerative medicine; however, improving the conversion efficiency and producing functional target cells remain challenging. Ectopic Atoh1 expression in non-sensory supporting cells (SCs) in mouse cochleae induces their partial conversion to hair cells (HCs) at low efficiency. Here, we performed single-cell RNA sequencing of whole mouse sensory epithelia harvested at multiple time points after conditional overexpression of Atoh1. Pseudotemporal ordering revealed that converted HCs (cHCs) are present along a conversion continuum that correlates with both endogenous and exogenous Atoh1 expression. Bulk sequencing of isolated cell populations and single-cell qPCR confirmed 51 transcription factors, including Isl1, are differentially expressed among cHCs, SCs and HCs. In transgenic mice, co-overexpression of Atoh1 and Isl1 enhanced the HC conversion efficiency. Together, our study shows how high-resolution transcriptional profiling of direct cell conversion can identify co-reprogramming factors required for efficient conversion.
Anemophilous plants described as catapulting pollen explosively into the air have rarely attracted detailed examination. We investigated floral anthesis in a male mulberry tree with high-speed video and a force probe. The stamen was inflexed within the floral bud. Exposure to dry air initially resulted in a gradual movement of the stamen. This caused fine threads to tear at the stomium, ensuring dehiscence of the anther, and subsequently enabled the anther to slip off a restraining pistillode. The sudden release of stored elastic energy in the spring-like filament drove the stamen to straighten in less than 25 μs, and reflex the petals to velocities in excess of half the speed of sound. This is the fastest motion yet observed in biology, and approaches the theoretical physical limits for movements in plants.
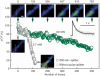
Pulsed lasers are key elements in nonlinear bioimaging techniques such as two-photon fluorescence excitation (TPE) microscopy. Typically, however, only a percent or less of the laser power available can be delivered to the sample before photoinduced damage becomes excessive. Here we describe a passive pulse splitter that converts each laser pulse into a fixed number of sub-pulses of equal energy. We applied the splitter to TPE imaging of fixed mouse brain slices labeled with GFP and show that, in different power regimes, the splitter can be used either to increase the signal rate more than 100-fold or to reduce the rate of photobleaching by over fourfold. In living specimens, the gains were even greater: a ninefold reduction in photobleaching during in vivo imaging of Caenorhabditis elegans larvae, and a six- to 20-fold decrease in the rate of photodamage during calcium imaging of rat hippocampal brain slices.
Pulsed lasers are key elements in nonlinear bioimaging techniques such as two-photon fluorescence excitation (TPE) microscopy. Typically, however, only a percent or less of the laser power available can be delivered to the sample before photoinduced damage becomes excessive. Here we describe a passive pulse splitter that converts each laser pulse into a fixed number of sub-pulses of equal energy. We applied the splitter to TPE imaging of fixed mouse brain slices labeled with GFP and show that, in different power regimes, the splitter can be used either to increase the signal rate more than 100-fold or to reduce the rate of photobleaching by over fourfold. In living specimens, the gains were even greater: a ninefold reduction in photobleaching during in vivo imaging of Caenorhabditis elegans larvae, and a six- to 20-fold decrease in the rate of photodamage during calcium imaging of rat hippocampal brain slices.
Commentary: Na Ji came to me early in her postdoc with an idea to reduce photodamage in nonlinear microscopy by splitting the pulses from an ultrafast laser into multiple subpulses of reduced energy. In six weeks, we constructed a prototype pulse splitter and obtained initial results confirming the validity of her vision. Further experiments with Jeff Magee demonstrated that the splitter could be used to increase imaging speed or reduce photodamage in two photon microscopy by one to two orders of magnitude. This project is a great example of how quickly one can react and exploit new ideas in the Janelia environment.
All organisms react to noxious and mechanical stimuli but we still lack a complete understanding of cellular and molecular mechanisms by which somatosensory information is transformed into appropriate motor outputs. The small number of neurons and excellent genetic tools make Drosophila larva an especially tractable model system in which to address this problem. We developed high throughput assays with which we can simultaneously expose more than 1,000 larvae per man-hour to precisely timed noxious heat, vibration, air current, or optogenetic stimuli. Using this hardware in combination with custom software we characterized larval reactions to somatosensory stimuli in far greater detail than possible previously. Each stimulus evoked a distinctive escape strategy that consisted of multiple actions. The escape strategy was context-dependent. Using our system we confirmed that the nociceptive class IV multidendritic neurons were involved in the reactions to noxious heat. Chordotonal (ch) neurons were necessary for normal modulation of head casting, crawling and hunching, in response to mechanical stimuli. Consistent with this we observed increases in calcium transients in response to vibration in ch neurons. Optogenetic activation of ch neurons was sufficient to evoke head casting and crawling. These studies significantly increase our understanding of the functional roles of larval ch neurons. More generally, our system and the detailed description of wild type reactions to somatosensory stimuli provide a basis for systematic identification of neurons and genes underlying these behaviors.
Learning which stimuli (classical conditioning) or which actions (operant conditioning) predict rewards or punishments can improve chances of survival. However, the circuit mechanisms that underlie distinct types of associative learning are still not fully understood. Automated, high-throughput paradigms for studying different types of associative learning, combined with manipulation of specific neurons in freely behaving animals, can help advance this field. The Drosophila melanogaster larva is a tractable model system for studying the circuit basis of behaviour, but many forms of associative learning have not yet been demonstrated in this animal. Here, we developed a high-throughput (i. e. multi-larva) training system that combines real-time behaviour detection of freely moving larvae with targeted opto- and thermogenetic stimulation of tracked animals. Both stimuli are controlled in either open- or closed-loop, and delivered with high temporal and spatial precision. Using this tracker, we show for the first time that Drosophila larvae can perform classical conditioning with no overlap between sensory stimuli (i. e. trace conditioning). We also demonstrate that larvae are capable of operant conditioning by inducing a bend direction preference through optogenetic activation of reward-encoding serotonergic neurons. Our results extend the known associative learning capacities of Drosophila larvae. Our automated training rig will facilitate the study of many different forms of associative learning and the identification of the neural circuits that underpin them.