Filter
Associated Lab
- Aguilera Castrejon Lab (19) Apply Aguilera Castrejon Lab filter
- Ahrens Lab (75) Apply Ahrens Lab filter
- Aso Lab (42) Apply Aso Lab filter
- Baker Lab (38) Apply Baker Lab filter
- Betzig Lab (116) Apply Betzig Lab filter
- Beyene Lab (15) Apply Beyene Lab filter
- Bock Lab (17) Apply Bock Lab filter
- Branson Lab (56) Apply Branson Lab filter
- Card Lab (43) Apply Card Lab filter
- Cardona Lab (64) Apply Cardona Lab filter
- Chklovskii Lab (13) Apply Chklovskii Lab filter
- Clapham Lab (16) Apply Clapham Lab filter
- Cui Lab (19) Apply Cui Lab filter
- Darshan Lab (12) Apply Darshan Lab filter
- Dennis Lab (3) Apply Dennis Lab filter
- Dickson Lab (46) Apply Dickson Lab filter
- Druckmann Lab (25) Apply Druckmann Lab filter
- Dudman Lab (58) Apply Dudman Lab filter
- Eddy/Rivas Lab (30) Apply Eddy/Rivas Lab filter
- Egnor Lab (11) Apply Egnor Lab filter
- Espinosa Medina Lab (25) Apply Espinosa Medina Lab filter
- Feliciano Lab (16) Apply Feliciano Lab filter
- Fetter Lab (41) Apply Fetter Lab filter
- FIB-SEM Technology (1) Apply FIB-SEM Technology filter
- Fitzgerald Lab (30) Apply Fitzgerald Lab filter
- Freeman Lab (15) Apply Freeman Lab filter
- Funke Lab (46) Apply Funke Lab filter
- Gonen Lab (91) Apply Gonen Lab filter
- Grigorieff Lab (62) Apply Grigorieff Lab filter
- Harris Lab (65) Apply Harris Lab filter
- Heberlein Lab (94) Apply Heberlein Lab filter
- Hermundstad Lab (32) Apply Hermundstad Lab filter
- Hess Lab (80) Apply Hess Lab filter
- Ilanges Lab (4) Apply Ilanges Lab filter
- Jayaraman Lab (49) Apply Jayaraman Lab filter
- Ji Lab (33) Apply Ji Lab filter
- Johnson Lab (7) Apply Johnson Lab filter
- Kainmueller Lab (19) Apply Kainmueller Lab filter
- Karpova Lab (15) Apply Karpova Lab filter
- Keleman Lab (13) Apply Keleman Lab filter
- Keller Lab (77) Apply Keller Lab filter
- Koay Lab (20) Apply Koay Lab filter
- Lavis Lab (162) Apply Lavis Lab filter
- Lee (Albert) Lab (34) Apply Lee (Albert) Lab filter
- Leonardo Lab (23) Apply Leonardo Lab filter
- Li Lab (32) Apply Li Lab filter
- Lippincott-Schwartz Lab (182) Apply Lippincott-Schwartz Lab filter
- Liu (Yin) Lab (9) Apply Liu (Yin) Lab filter
- Liu (Zhe) Lab (65) Apply Liu (Zhe) Lab filter
- Looger Lab (138) Apply Looger Lab filter
- Magee Lab (49) Apply Magee Lab filter
- Menon Lab (18) Apply Menon Lab filter
- Murphy Lab (13) Apply Murphy Lab filter
- O'Shea Lab (8) Apply O'Shea Lab filter
- Otopalik Lab (13) Apply Otopalik Lab filter
- Pachitariu Lab (56) Apply Pachitariu Lab filter
- Pastalkova Lab (19) Apply Pastalkova Lab filter
- Pavlopoulos Lab (19) Apply Pavlopoulos Lab filter
- Pedram Lab (15) Apply Pedram Lab filter
- Podgorski Lab (16) Apply Podgorski Lab filter
- Reiser Lab (55) Apply Reiser Lab filter
- Riddiford Lab (44) Apply Riddiford Lab filter
- Romani Lab (52) Apply Romani Lab filter
- Rubin Lab (149) Apply Rubin Lab filter
- Saalfeld Lab (66) Apply Saalfeld Lab filter
- Satou Lab (18) Apply Satou Lab filter
- Scheffer Lab (38) Apply Scheffer Lab filter
- Schreiter Lab (72) Apply Schreiter Lab filter
- Schulze Lab (1) Apply Schulze Lab filter
- Sgro Lab (23) Apply Sgro Lab filter
- Shroff Lab (35) Apply Shroff Lab filter
- Simpson Lab (23) Apply Simpson Lab filter
- Singer Lab (80) Apply Singer Lab filter
- Spruston Lab (98) Apply Spruston Lab filter
- Stern Lab (160) Apply Stern Lab filter
- Sternson Lab (54) Apply Sternson Lab filter
- Stringer Lab (44) Apply Stringer Lab filter
- Svoboda Lab (136) Apply Svoboda Lab filter
- Tebo Lab (36) Apply Tebo Lab filter
- Tervo Lab (10) Apply Tervo Lab filter
- Tillberg Lab (22) Apply Tillberg Lab filter
- Tjian Lab (64) Apply Tjian Lab filter
- Truman Lab (88) Apply Truman Lab filter
- Turaga Lab (53) Apply Turaga Lab filter
- Turner Lab (38) Apply Turner Lab filter
- Vale Lab (8) Apply Vale Lab filter
- Voigts Lab (5) Apply Voigts Lab filter
- Wang (Meng) Lab (31) Apply Wang (Meng) Lab filter
- Wang (Shaohe) Lab (25) Apply Wang (Shaohe) Lab filter
- Wong-Campos Lab (1) Apply Wong-Campos Lab filter
- Wu Lab (9) Apply Wu Lab filter
- Zlatic Lab (28) Apply Zlatic Lab filter
- Zuker Lab (25) Apply Zuker Lab filter
Associated Project Team
- CellMap (13) Apply CellMap filter
- COSEM (3) Apply COSEM filter
- FIB-SEM Technology (5) Apply FIB-SEM Technology filter
- Fly Descending Interneuron (12) Apply Fly Descending Interneuron filter
- Fly Functional Connectome (14) Apply Fly Functional Connectome filter
- Fly Olympiad (5) Apply Fly Olympiad filter
- FlyEM (56) Apply FlyEM filter
- FlyLight (50) Apply FlyLight filter
- GENIE (47) Apply GENIE filter
- Integrative Imaging (11) Apply Integrative Imaging filter
- Larval Olympiad (2) Apply Larval Olympiad filter
- MouseLight (18) Apply MouseLight filter
- NeuroSeq (1) Apply NeuroSeq filter
- ThalamoSeq (1) Apply ThalamoSeq filter
- Tool Translation Team (T3) (29) Apply Tool Translation Team (T3) filter
- Transcription Imaging (49) Apply Transcription Imaging filter
Publication Date
- 2026 (118) Apply 2026 filter
- 2025 (223) Apply 2025 filter
- 2024 (209) Apply 2024 filter
- 2023 (158) Apply 2023 filter
- 2022 (192) Apply 2022 filter
- 2021 (194) Apply 2021 filter
- 2020 (196) Apply 2020 filter
- 2019 (202) Apply 2019 filter
- 2018 (232) Apply 2018 filter
- 2017 (217) Apply 2017 filter
- 2016 (209) Apply 2016 filter
- 2015 (252) Apply 2015 filter
- 2014 (236) Apply 2014 filter
- 2013 (194) Apply 2013 filter
- 2012 (190) Apply 2012 filter
- 2011 (190) Apply 2011 filter
- 2010 (161) Apply 2010 filter
- 2009 (158) Apply 2009 filter
- 2008 (140) Apply 2008 filter
- 2007 (106) Apply 2007 filter
- 2006 (92) Apply 2006 filter
- 2005 (67) Apply 2005 filter
- 2004 (57) Apply 2004 filter
- 2003 (58) Apply 2003 filter
- 2002 (39) Apply 2002 filter
- 2001 (28) Apply 2001 filter
- 2000 (29) Apply 2000 filter
- 1999 (14) Apply 1999 filter
- 1998 (18) Apply 1998 filter
- 1997 (16) Apply 1997 filter
- 1996 (10) Apply 1996 filter
- 1995 (18) Apply 1995 filter
- 1994 (12) Apply 1994 filter
- 1993 (10) Apply 1993 filter
- 1992 (6) Apply 1992 filter
- 1991 (11) Apply 1991 filter
- 1990 (11) Apply 1990 filter
- 1989 (6) Apply 1989 filter
- 1988 (1) Apply 1988 filter
- 1987 (7) Apply 1987 filter
- 1986 (4) Apply 1986 filter
- 1985 (5) Apply 1985 filter
- 1984 (2) Apply 1984 filter
- 1983 (2) Apply 1983 filter
- 1982 (3) Apply 1982 filter
- 1981 (3) Apply 1981 filter
- 1980 (1) Apply 1980 filter
- 1979 (1) Apply 1979 filter
- 1976 (2) Apply 1976 filter
- 1973 (1) Apply 1973 filter
- 1970 (1) Apply 1970 filter
- 1967 (1) Apply 1967 filter
Type of Publication
4313 Publications
Showing 2961-2970 of 4313 resultsGenes include cis-regulatory regions that contain transcriptional enhancers. Recent reports have shown that developmental genes often possess multiple discrete enhancer modules that drive transcription in similar spatio-temporal patterns: primary enhancers located near the basal promoter and secondary, or ’shadow’, enhancers located at more remote positions. It has been proposed that the seemingly redundant activity of primary and secondary enhancers contributes to phenotypic robustness. We tested this hypothesis by generating a deficiency that removes two newly discovered enhancers of shavenbaby (svb, a transcript of the ovo locus), a gene encoding a transcription factor that directs development of Drosophila larval trichomes. At optimal temperatures for embryonic development, this deficiency causes minor defects in trichome patterning. In embryos that develop at both low and high extreme temperatures, however, absence of these secondary enhancers leads to extensive loss of trichomes. These temperature-dependent defects can be rescued by a transgene carrying a secondary enhancer driving transcription of the svb cDNA. Finally, removal of one copy of wingless, a gene required for normal trichome patterning, causes a similar loss of trichomes only in flies lacking the secondary enhancers. These results support the hypothesis that secondary enhancers contribute to phenotypic robustness in the face of environmental and genetic variability.
An HTS screening campaign identified a series of low molecular weight phenols that showed excellent selectivity (>100-fold) for HDAC1/HDAC2 over other Class I and Class II HDACs. Evolution and optimization of this HTS hit series provided HDAC1-selective (SHI-1) compounds with excellent anti-proliferative activity and improved physical properties. Dose-dependent efficacy in a mouse HCT116 xenograft model was demonstrated with a phenylglycine SHI-1 analog.
The antennae of male silk moths are extremely sensitive to the female sex pheromone such that a male moth can find a female up to 4.5 km away. This remarkable sensitivity is due to both the morphological and biochemical design of these antennae. Along the branches of the plumose antennae are the sensilla trichodea, each consisting of a hollow cuticular hair containing two unbranched dendrites bathed in a fluid, the receptor lymph ,3. The dendrites and receptor lymph are isolated from the haemolymph by a barrier of epidermal cells which secreted the cuticular hair. Pheromone molecules are thought to diffuse down 100 A-wide pore tubules through the cuticular wall and across the receptor lymph space to receptors located in the dendritic membrane. To prevent the accumulation of residual stimulant and hence sensory adaptation, the pheromone molecules are subsequently inactivated in an apparent two-step process of rapid ’early inactivation’ followed by much slower enzymatic degradation. The biochemistry involved in this sequence of events is largely unknown. We report here the identification of three proteins which interact with the pheromone of the wild silk moth Antheraea polyphemus: a pheromone-binding protein and a pheromone-degrading esterase, both uniquely located in the pheromone-sensitive sensilla; and a second esterase common to all cuticular tissues except the sensilla.
Proteomic studies have identified thousands of eukaryotic phosphorylation sites (phosphosites), but few are functionally characterized. Nishi et al., in this issue of Structure, characterize phosphosites at protein-protein interfaces and estimate the effect of their phosphorylation on interaction affinity, by combining proteomics data with protein structures.
{At distal dendritic locations, the threshold for action potential generation is higher and the amplitude of back-propagating spikes is decreased. To study whether these characteristics depend upon Na+ channels, their voltage-dependent properties at proximal and distal dendritic locations were compared in CA1 hippocampal neurons. Distal Na+ channels activated at more hyperpolarized voltages than proximal (half-activation voltages were -20.4 +/- 2.4 mV vs. -12.0 +/- 1.7 mV for distal and proximal patches, respectively
Photoactivatable pharmacological agents have revolutionized neuroscience, but the palette of available compounds is limited. We describe a general method for caging tertiary amines by using a stable quaternary ammonium linkage that elicits a red shift in the activation wavelength. We prepared a photoactivatable nicotine (PA-Nic), uncageable via one- or two-photon excitation, that is useful to study nicotinic acetylcholine receptors (nAChRs) in different experimental preparations and spatiotemporal scales.
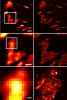
Key to understanding a protein’s biological function is the accurate determination of its spatial distribution inside a cell. Although fluorescent protein markers allow the targeting of specific proteins with molecular precision, much of this information is lost when the resultant fusion proteins are imaged with conventional, diffraction-limited optics. In response, several imaging modalities that are capable of resolution below the diffraction limit (approximately 200 nm) have emerged. Here, both single- and dual-color superresolution imaging of biological structures using photoactivated localization microscopy (PALM) are described. The examples discussed focus on adhesion complexes: dense, protein-filled assemblies that form at the interface between cells and their substrata. A particular emphasis is placed on the instrumentation and photoactivatable fluorescent protein (PA-FP) tags necessary to achieve PALM images at approximately 20 nm resolution in 5 to 30 min in fixed cells.
Commentary: A paper spearheaded by Hari which gives a thorough description of the methods and hardware needed to successfully practice PALM, including cover slip preparation, cell transfection and fixation, drift correction with fiducials, characterization of on/off contrast ratios for different photoactivted fluorescent proteins, identifying PALM-suitable cells, and mechanical and optical components of a PALM system.
Superresolution fluorescence microscopy permits the study of biological processes at scales small enough to visualize fine subcellular structures that are unresolvable by traditional diffraction-limited light microscopy. Many superresolution techniques, including those applicable to live cell imaging, utilize genetically encoded photocontrollable fluorescent proteins. The fluorescence of these proteins can be controlled by light of specific wavelengths. In this review, we discuss the biochemical and photophysical properties of photocontrollable fluorescent proteins that are relevant to their use in superresolution microscopy. We then describe the recently developed photoactivatable, photoswitchable, and reversibly photoswitchable fluorescent proteins, and we detail their particular usefulness in single-molecule localization-based and nonlinear ensemble-based superresolution techniques. Finally, we discuss recent applications of photocontrollable proteins in superresolution imaging, as well as how these applications help to clarify properties of intracellular structures and processes that are relevant to cell and developmental biology, neuroscience, cancer biology and biomedicine.
By providing quantitative, visual data of live cells, fluorescent protein-based microscopy techniques are furnishing novel insights into the complexities of membrane trafficking pathways and organelle dynamics. In this chapter, we describe experimental protocols employing fluorescent protein-based photohighlighting techniques to quantify protein movement into and out of the Golgi apparatus, an organelle that serves as the central sorting and processing station of the secretory pathway. The methods allow kinetic characteristics of Golgi-associated protein trafficking to be deciphered, which can help clarify how the Golgi maintains itself as a steady-state structure despite a continuous flux of secretory cargo passing into and out of this organelle. The guidelines presented in this chapter can also be applied to examine the dynamics of other intracellular organelle systems, elucidating mechanisms for how proteins are maintained in specific organelles and/or circulated to other destinations within the cell.
Optical approaches for tracking neural dynamics are of widespread interest, but a theoretical framework quantifying the physical limits of these techniques has been lacking. We formulate such a framework by using signal detection and estimation theory to obtain physical bounds on the detection of neural spikes and the estimation of their occurrence times as set by photon counting statistics (shot noise). These bounds are succinctly expressed via a discriminability index that depends on the kinetics of the optical indicator and the relative fluxes of signal and background photons. This approach facilitates quantitative evaluations of different indicators, detector technologies, and data analyses. Our treatment also provides optimal filtering techniques for optical detection of spikes. We compare various types of Ca(2+) indicators and show that background photons are a chief impediment to voltage sensing. Thus, voltage indicators that change color in response to membrane depolarization may offer a key advantage over those that change intensity. We also examine fluorescence resonance energy transfer indicators and identify the regimes in which the widely used ratiometric analysis of signals is substantially suboptimal. Overall, by showing how different optical factors interact to affect signal quality, our treatment offers a valuable guide to experimental design and provides measures of confidence to assess optically extracted traces of neural activity.