Main Menu (Mobile)- Block
- Overview
-
Support Teams
- Overview
- Anatomy and Histology
- Cryo-Electron Microscopy
- Electron Microscopy
- Flow Cytometry
- Gene Targeting and Transgenics
- High Performance Computing
- Immortalized Cell Line Culture
- Integrative Imaging
- Invertebrate Shared Resource
- Janelia Experimental Technology
- Mass Spectrometry
- Media Prep
- Molecular Genomics
- Stem Cell & Primary Culture
- Project Pipeline Support
- Project Technical Resources
- Quantitative Genomics
- Scientific Computing
- Viral Tools
- Vivarium
- Open Science
- You + Janelia
- About Us
Main Menu - Block
- Overview
- Anatomy and Histology
- Cryo-Electron Microscopy
- Electron Microscopy
- Flow Cytometry
- Gene Targeting and Transgenics
- High Performance Computing
- Immortalized Cell Line Culture
- Integrative Imaging
- Invertebrate Shared Resource
- Janelia Experimental Technology
- Mass Spectrometry
- Media Prep
- Molecular Genomics
- Stem Cell & Primary Culture
- Project Pipeline Support
- Project Technical Resources
- Quantitative Genomics
- Scientific Computing
- Viral Tools
- Vivarium
Hippocampus RNA-seq atlas
Site and Data Description
At the Hippocampus RNA-seq atlas site, you can interactively analyze and visualize RNA-seq data for all excitatory cell populations in the hippocampus at multiple levels of granularity. Analysis can be hypothesis-driven by supplying predetermined lists of genes, or the dataset can be explored in a gene discovery-based fashion using enrichment and/or differential expression queries. To get started, select the population(s) of excitatory cells you are interested in analyzing, choose your desired level of analysis, and follow the prompts. Researchers can easily download any figures or data generated during online analysis. Additionally, they can also download the full dataset of gene expression values for offline analysis in other environments.
Methodology
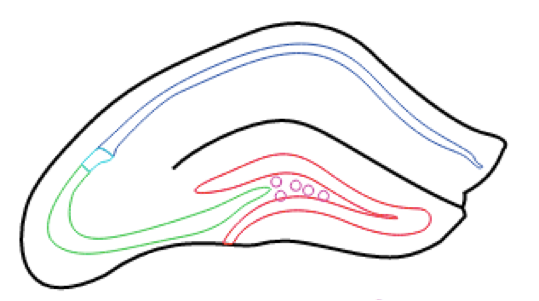
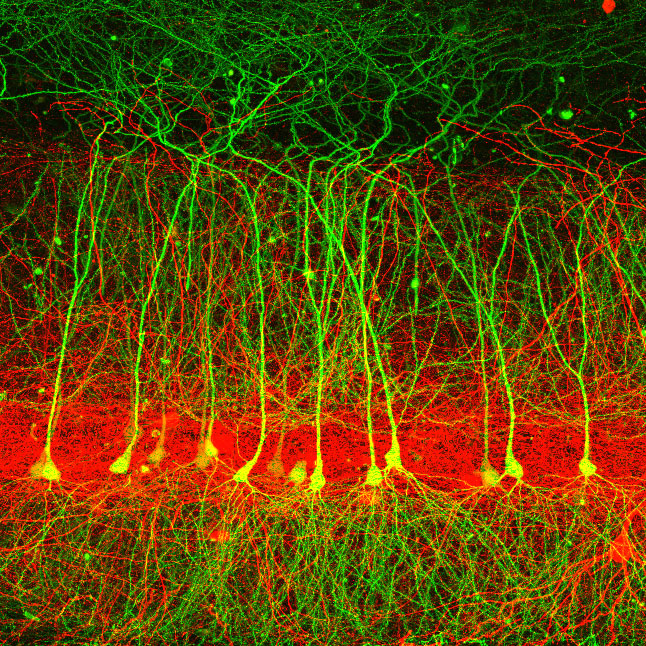
Transgenic mice were used to label various populations of hippocampal principal cells fluorescently. Animals were sacrificed between P25-P32, and scientists performed manual sorting to purify fluorescent neurons from microdissected brain slices. Approximately 100 cells were obtained per animal, and three animals (i.e., three biological replicates) were obtained for each dataset.
For library preparation, total RNA was isolated, researchers added ERCC spike-in controls, and cDNA was amplified from this input material. Sequencing libraries were constructed from the amplified cDNA, and four barcoded libraries were pooled per sequencing lane on a HiSeq 2500. The single-end 100 bp reads generated from sequencing were aligned, quantified, and analyzed with the TuxedoSuite pipeline, which outputs gene expression as FPKM (Fragments Per Kilobase of Exon Per Million Reads Mapped) and assesses differential expression with a false discovery rate cutoff (typically 5%).
For additional details, see:
Cembrowski, M.S., Wang., L., Sugino, K., Shields, B.C., Spruston, N.
Hipposeq: a comprehensive RNA-seq database of gene expression in hippocampal principal neurons.
eLife 5, 10.7554/eLife.14997 (2016).