Filter
Associated Lab
- Aguilera Castrejon Lab (19) Apply Aguilera Castrejon Lab filter
- Ahrens Lab (73) Apply Ahrens Lab filter
- Aso Lab (42) Apply Aso Lab filter
- Baker Lab (38) Apply Baker Lab filter
- Betzig Lab (116) Apply Betzig Lab filter
- Beyene Lab (15) Apply Beyene Lab filter
- Bock Lab (17) Apply Bock Lab filter
- Branson Lab (55) Apply Branson Lab filter
- Card Lab (43) Apply Card Lab filter
- Cardona Lab (64) Apply Cardona Lab filter
- Chklovskii Lab (13) Apply Chklovskii Lab filter
- Clapham Lab (16) Apply Clapham Lab filter
- Cui Lab (19) Apply Cui Lab filter
- Darshan Lab (12) Apply Darshan Lab filter
- Dennis Lab (3) Apply Dennis Lab filter
- Dickson Lab (46) Apply Dickson Lab filter
- Druckmann Lab (25) Apply Druckmann Lab filter
- Dudman Lab (56) Apply Dudman Lab filter
- Eddy/Rivas Lab (30) Apply Eddy/Rivas Lab filter
- Egnor Lab (11) Apply Egnor Lab filter
- Espinosa Medina Lab (23) Apply Espinosa Medina Lab filter
- Feliciano Lab (12) Apply Feliciano Lab filter
- Fetter Lab (41) Apply Fetter Lab filter
- FIB-SEM Technology (1) Apply FIB-SEM Technology filter
- Fitzgerald Lab (30) Apply Fitzgerald Lab filter
- Freeman Lab (15) Apply Freeman Lab filter
- Funke Lab (46) Apply Funke Lab filter
- Gonen Lab (91) Apply Gonen Lab filter
- Grigorieff Lab (62) Apply Grigorieff Lab filter
- Harris Lab (65) Apply Harris Lab filter
- Heberlein Lab (94) Apply Heberlein Lab filter
- Hermundstad Lab (30) Apply Hermundstad Lab filter
- Hess Lab (80) Apply Hess Lab filter
- Ilanges Lab (4) Apply Ilanges Lab filter
- Jayaraman Lab (48) Apply Jayaraman Lab filter
- Ji Lab (33) Apply Ji Lab filter
- Johnson Lab (6) Apply Johnson Lab filter
- Kainmueller Lab (19) Apply Kainmueller Lab filter
- Karpova Lab (15) Apply Karpova Lab filter
- Keleman Lab (13) Apply Keleman Lab filter
- Keller Lab (76) Apply Keller Lab filter
- Koay Lab (20) Apply Koay Lab filter
- Lavis Lab (158) Apply Lavis Lab filter
- Lee (Albert) Lab (34) Apply Lee (Albert) Lab filter
- Leonardo Lab (23) Apply Leonardo Lab filter
- Li Lab (32) Apply Li Lab filter
- Lippincott-Schwartz Lab (180) Apply Lippincott-Schwartz Lab filter
- Liu (Yin) Lab (8) Apply Liu (Yin) Lab filter
- Liu (Zhe) Lab (65) Apply Liu (Zhe) Lab filter
- Looger Lab (138) Apply Looger Lab filter
- Magee Lab (49) Apply Magee Lab filter
- Menon Lab (18) Apply Menon Lab filter
- Murphy Lab (13) Apply Murphy Lab filter
- O'Shea Lab (8) Apply O'Shea Lab filter
- Otopalik Lab (13) Apply Otopalik Lab filter
- Pachitariu Lab (54) Apply Pachitariu Lab filter
- Pastalkova Lab (19) Apply Pastalkova Lab filter
- Pavlopoulos Lab (19) Apply Pavlopoulos Lab filter
- Pedram Lab (15) Apply Pedram Lab filter
- Podgorski Lab (16) Apply Podgorski Lab filter
- Reiser Lab (55) Apply Reiser Lab filter
- Riddiford Lab (44) Apply Riddiford Lab filter
- Romani Lab (51) Apply Romani Lab filter
- Rubin Lab (149) Apply Rubin Lab filter
- Saalfeld Lab (64) Apply Saalfeld Lab filter
- Satou Lab (18) Apply Satou Lab filter
- Scheffer Lab (38) Apply Scheffer Lab filter
- Schreiter Lab (70) Apply Schreiter Lab filter
- Schulze Lab (1) Apply Schulze Lab filter
- Sgro Lab (23) Apply Sgro Lab filter
- Shroff Lab (31) Apply Shroff Lab filter
- Simpson Lab (23) Apply Simpson Lab filter
- Singer Lab (80) Apply Singer Lab filter
- Spruston Lab (98) Apply Spruston Lab filter
- Stern Lab (160) Apply Stern Lab filter
- Sternson Lab (54) Apply Sternson Lab filter
- Stringer Lab (43) Apply Stringer Lab filter
- Svoboda Lab (136) Apply Svoboda Lab filter
- Tebo Lab (35) Apply Tebo Lab filter
- Tervo Lab (10) Apply Tervo Lab filter
- Tillberg Lab (22) Apply Tillberg Lab filter
- Tjian Lab (64) Apply Tjian Lab filter
- Truman Lab (88) Apply Truman Lab filter
- Turaga Lab (53) Apply Turaga Lab filter
- Turner Lab (38) Apply Turner Lab filter
- Vale Lab (8) Apply Vale Lab filter
- Voigts Lab (4) Apply Voigts Lab filter
- Wang (Meng) Lab (29) Apply Wang (Meng) Lab filter
- Wang (Shaohe) Lab (25) Apply Wang (Shaohe) Lab filter
- Wong-Campos Lab (1) Apply Wong-Campos Lab filter
- Wu Lab (9) Apply Wu Lab filter
- Zlatic Lab (28) Apply Zlatic Lab filter
- Zuker Lab (25) Apply Zuker Lab filter
Associated Project Team
- CellMap (13) Apply CellMap filter
- COSEM (3) Apply COSEM filter
- FIB-SEM Technology (5) Apply FIB-SEM Technology filter
- Fly Descending Interneuron (12) Apply Fly Descending Interneuron filter
- Fly Functional Connectome (14) Apply Fly Functional Connectome filter
- Fly Olympiad (5) Apply Fly Olympiad filter
- FlyEM (56) Apply FlyEM filter
- FlyLight (50) Apply FlyLight filter
- GENIE (47) Apply GENIE filter
- Integrative Imaging (9) Apply Integrative Imaging filter
- Larval Olympiad (2) Apply Larval Olympiad filter
- MouseLight (18) Apply MouseLight filter
- NeuroSeq (1) Apply NeuroSeq filter
- ThalamoSeq (1) Apply ThalamoSeq filter
- Tool Translation Team (T3) (29) Apply Tool Translation Team (T3) filter
- Transcription Imaging (49) Apply Transcription Imaging filter
Publication Date
- 2026 (74) Apply 2026 filter
- 2025 (222) Apply 2025 filter
- 2024 (210) Apply 2024 filter
- 2023 (158) Apply 2023 filter
- 2022 (192) Apply 2022 filter
- 2021 (194) Apply 2021 filter
- 2020 (196) Apply 2020 filter
- 2019 (202) Apply 2019 filter
- 2018 (232) Apply 2018 filter
- 2017 (217) Apply 2017 filter
- 2016 (209) Apply 2016 filter
- 2015 (252) Apply 2015 filter
- 2014 (236) Apply 2014 filter
- 2013 (194) Apply 2013 filter
- 2012 (190) Apply 2012 filter
- 2011 (190) Apply 2011 filter
- 2010 (161) Apply 2010 filter
- 2009 (158) Apply 2009 filter
- 2008 (140) Apply 2008 filter
- 2007 (106) Apply 2007 filter
- 2006 (92) Apply 2006 filter
- 2005 (67) Apply 2005 filter
- 2004 (57) Apply 2004 filter
- 2003 (58) Apply 2003 filter
- 2002 (39) Apply 2002 filter
- 2001 (28) Apply 2001 filter
- 2000 (29) Apply 2000 filter
- 1999 (14) Apply 1999 filter
- 1998 (18) Apply 1998 filter
- 1997 (16) Apply 1997 filter
- 1996 (10) Apply 1996 filter
- 1995 (18) Apply 1995 filter
- 1994 (12) Apply 1994 filter
- 1993 (10) Apply 1993 filter
- 1992 (6) Apply 1992 filter
- 1991 (11) Apply 1991 filter
- 1990 (11) Apply 1990 filter
- 1989 (6) Apply 1989 filter
- 1988 (1) Apply 1988 filter
- 1987 (7) Apply 1987 filter
- 1986 (4) Apply 1986 filter
- 1985 (5) Apply 1985 filter
- 1984 (2) Apply 1984 filter
- 1983 (2) Apply 1983 filter
- 1982 (3) Apply 1982 filter
- 1981 (3) Apply 1981 filter
- 1980 (1) Apply 1980 filter
- 1979 (1) Apply 1979 filter
- 1976 (2) Apply 1976 filter
- 1973 (1) Apply 1973 filter
- 1970 (1) Apply 1970 filter
- 1967 (1) Apply 1967 filter
Type of Publication
4269 Publications
Showing 1781-1790 of 4269 resultsRandom scattering and aberrations severely limit the imaging depth in optical microscopy. We introduce a rapid, parallel wavefront compensation technique that efficiently compensates even highly complex phase distortions. Using coherence gated backscattered light as a feedback signal, we focus light deep inside highly scattering brain tissue. We demonstrate that the same wavefront optimization technique can also be used to compensate spectral phase distortions in ultrashort laser pulses using nonlinear iterative feedback. We can restore transform limited pulse durations at any selected target location and compensate for dispersion that has occurred in the optical train and within the sample.
We describe a procedure for designing proteins with backbones produced by varying the parameters in the Crick coiled coil-generating equations. Combinatorial design calculations identify low-energy sequences for alternative helix supercoil arrangements, and the helices in the lowest-energy arrangements are connected by loop building. We design an antiparallel monomeric untwisted three-helix bundle with 80-residue helices, an antiparallel monomeric right-handed four-helix bundle, and a pentameric parallel left-handed five-helix bundle. The designed proteins are extremely stable (extrapolated ΔGfold > 60 kilocalories per mole), and their crystal structures are close to those of the design models with nearly identical core packing between the helices. The approach enables the custom design of hyperstable proteins with fine-tuned geometries for a wide range of applications.
Two-photon microscopy together with fluorescent proteins and fluorescent protein-based biosensors are commonly used tools in neuroscience. To enhance their experimental scope, it is important to optimize fluorescent proteins for two-photon excitation. Directed evolution of fluorescent proteins under one-photon excitation is common, but many one-photon properties do not correlate with two-photon properties. A simple system for expressing fluorescent protein mutants is colonies on an agar plate. The small focal volume of two-photon excitation makes creating a high throughput screen in this system a challenge for a conventional point-scanning approach. We present an instrument and accompanying software that solves this challenge by selectively scanning each colony based on a colony map captured under one-photon excitation. This instrument, called the GIZMO, can measure the two-photon excited fluorescence of 10,000 colonies in 7 hours. We show that the GIZMO can be used to evolve a fluorescent protein under two-photon excitation.
Membrane proteins play a tremendously important role in cell physiology and serve as a target for an increasing number of drugs. Structural information is key to understanding their function and for developing new strategies for combating disease. However, the complex physical chemistry associated with membrane proteins has made them more difficult to study than their soluble cousins. Electron crystallography has historically been a successful method for solving membrane protein structures and has the advantage of providing a native lipid environment for these proteins. Specifically, when membrane proteins form two-dimensional arrays within a lipid bilayer, electron microscopy can be used to collect images and diffraction and the corresponding data can be combined to produce a three-dimensional reconstruction, which under favorable conditions can extend to atomic resolution. Like X-ray crystallography, the quality of the structures are very much dependent on the order and size of the crystals. However, unlike X-ray crystallography, high-throughput methods for screening crystallization trials for electron crystallography are not in general use. In this chapter, we describe two alternative methods for high-throughput screening of membrane protein crystallization within the lipid bilayer. The first method relies on the conventional use of dialysis for removing detergent and thus reconstituting the bilayer; an array of dialysis wells in the standard 96-well format allows the use of a liquid-handling robot and greatly increases throughput. The second method relies on titration of cyclodextrin as a chelating agent for detergent; a specialized pipetting robot has been designed not only to add cyclodextrin in a systematic way, but to use light scattering to monitor the reconstitution process. In addition, the use of liquid-handling robots for making negatively stained grids and methods for automatically imaging samples in the electron microscope are described.
Systemic lupus erythematosus (SLE) has a strong but incompletely understood genetic architecture. We conducted an association study with replication in 4,478 SLE cases and 12,656 controls from six East Asian cohorts to identify new SLE susceptibility loci and better localize known loci. We identified ten new loci and confirmed 20 known loci with genome-wide significance. Among the new loci, the most significant locus was GTF2IRD1-GTF2I at 7q11.23 (rs73366469, Pmeta = 3.75 × 10(-117), odds ratio (OR) = 2.38), followed by DEF6, IL12B, TCF7, TERT, CD226, PCNXL3, RASGRP1, SYNGR1 and SIGLEC6. We identified the most likely functional variants at each locus by analyzing epigenetic marks and gene expression data. Ten candidate variants are known to alter gene expression in cis or in trans. Enrichment analysis highlights the importance of these loci in B cell and T cell biology. The new loci, together with previously known loci, increase the explained heritability of SLE to 24%. The new loci share functional and ontological characteristics with previously reported loci and are possible drug targets for SLE therapeutics.
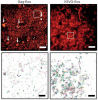
We combined photoactivated localization microscopy (PALM) with live-cell single-particle tracking to create a new method termed sptPALM. We created spatially resolved maps of single-molecule motions by imaging the membrane proteins Gag and VSVG, and obtained several orders of magnitude more trajectories per cell than traditional single-particle tracking enables. By probing distinct subsets of molecules, sptPALM can provide insight into the origins of spatial and temporal heterogeneities in membranes.
Commentary: As a stepping stone to true live cell PALM (see above), our collaborator Jennifer Lippincott-Schwartz suggested using the sparse photoactivation principle of PALM to track the nanoscale motion of thousands of individual molecules within a single living cell. Termed single particle tracking PALM (sptPALM), Jennifer’s postdocs Suliana Manley and Jen Gillette used the method in our PALM rig to create spatially resolved maps of diffusion rates in the plasma membrane of live cells. sptPALM is a powerful tool to study the active cytoskeletal or passive diffusional transport of individual molecules with far more measurements per cell than is possible without sparse photoactivation.
Extending three-dimensional (3D) single-molecule localization microscopy away from the coverslip and into thicker specimens will greatly broaden its biological utility. However, because of the limitations of both conventional imaging modalities and conventional labeling techniques, it is a challenge to localize molecules in three dimensions with high precision in such samples while simultaneously achieving the labeling densities required for high resolution of densely crowded structures. Here we combined lattice light-sheet microscopy with newly developed, freely diffusing, cell-permeable chemical probes with targeted affinity for DNA, intracellular membranes or the plasma membrane. We used this combination to perform high-localization precision, ultrahigh-labeling density, multicolor localization microscopy in samples up to 20 μm thick, including dividing cells and the neuromast organ of a zebrafish embryo. We also demonstrate super-resolution correlative imaging with protein-specific photoactivable fluorophores, providing a mutually compatible, single-platform alternative to correlative light-electron microscopy over large volumes.
A neuronal population encodes information most efficiently when its activity is uncorrelated and high-dimensional, and most robustly when its activity is correlated and lower-dimensional. Here, we analyzed the correlation structure of natural image coding, in large visual cortical populations recorded from awake mice. Evoked population activity was high dimensional, with correlations obeying an unexpected power-law: the n-th principal component variance scaled as 1/n. This was not inherited from the 1/f spectrum of natural images, because it persisted after stimulus whitening. We proved mathematically that the variance spectrum must decay at least this fast if a population code is smooth, i.e. if small changes in input cannot dominate population activity. The theory also predicts larger power-law exponents for lower-dimensional stimulus ensembles, which we validated experimentally. These results suggest that coding smoothness represents a fundamental constraint governing correlations in neural population codes.
Live-cell super-resolution microscopy enables the imaging of biological structure dynamics below the diffraction limit. Here we present enhanced super-resolution radial fluctuations (eSRRF), substantially improving image fidelity and resolution compared to the original SRRF method. eSRRF incorporates automated parameter optimization based on the data itself, giving insight into the trade-off between resolution and fidelity. We demonstrate eSRRF across a range of imaging modalities and biological systems. Notably, we extend eSRRF to three dimensions by combining it with multifocus microscopy. This realizes live-cell volumetric super-resolution imaging with an acquisition speed of ~1 volume per second. eSRRF provides an accessible super-resolution approach, maximizing information extraction across varied experimental conditions while minimizing artifacts. Its optimal parameter prediction strategy is generalizable, moving toward unbiased and optimized analyses in super-resolution microscopy.
The ability to probe the membrane potential of multiple genetically defined neurons simultaneously would have a profound impact on neuroscience research. Genetically encoded voltage indicators are a promising tool for this purpose, and recent developments have achieved a high signal-to-noise ratio in vivo with 1-photon fluorescence imaging. However, these recordings exhibit several sources of noise and signal extraction remains a challenge. We present an improved signal extraction pipeline, spike-guided penalized matrix decomposition-nonnegative matrix factorization (SGPMD-NMF), which resolves supra- and subthreshold voltages in vivo. The method incorporates biophysical and optical constraints. We validate the pipeline with simultaneous patch-clamp and optical recordings from mouse layer 1 in vivo and with simulated and composite datasets with realistic noise. We demonstrate applications to mouse hippocampus expressing paQuasAr3-s or SomArchon1, mouse cortex expressing SomArchon1 or Voltron, and zebrafish spines expressing zArchon1.