Filter
Associated Lab
- Aguilera Castrejon Lab (4) Apply Aguilera Castrejon Lab filter
- Ahrens Lab (62) Apply Ahrens Lab filter
- Aso Lab (42) Apply Aso Lab filter
- Baker Lab (19) Apply Baker Lab filter
- Betzig Lab (104) Apply Betzig Lab filter
- Beyene Lab (10) Apply Beyene Lab filter
- Bock Lab (14) Apply Bock Lab filter
- Branson Lab (52) Apply Branson Lab filter
- Card Lab (37) Apply Card Lab filter
- Cardona Lab (45) Apply Cardona Lab filter
- Chklovskii Lab (10) Apply Chklovskii Lab filter
- Clapham Lab (15) Apply Clapham Lab filter
- Cui Lab (19) Apply Cui Lab filter
- Darshan Lab (8) Apply Darshan Lab filter
- Dennis Lab (2) Apply Dennis Lab filter
- Dickson Lab (32) Apply Dickson Lab filter
- Druckmann Lab (21) Apply Druckmann Lab filter
- Dudman Lab (44) Apply Dudman Lab filter
- Eddy/Rivas Lab (30) Apply Eddy/Rivas Lab filter
- Egnor Lab (4) Apply Egnor Lab filter
- Espinosa Medina Lab (19) Apply Espinosa Medina Lab filter
- Feliciano Lab (12) Apply Feliciano Lab filter
- Fetter Lab (31) Apply Fetter Lab filter
- FIB-SEM Technology (1) Apply FIB-SEM Technology filter
- Fitzgerald Lab (17) Apply Fitzgerald Lab filter
- Freeman Lab (15) Apply Freeman Lab filter
- Funke Lab (46) Apply Funke Lab filter
- Gonen Lab (59) Apply Gonen Lab filter
- Grigorieff Lab (34) Apply Grigorieff Lab filter
- Harris Lab (55) Apply Harris Lab filter
- Heberlein Lab (13) Apply Heberlein Lab filter
- Hermundstad Lab (26) Apply Hermundstad Lab filter
- Hess Lab (77) Apply Hess Lab filter
- Ilanges Lab (4) Apply Ilanges Lab filter
- Jayaraman Lab (44) Apply Jayaraman Lab filter
- Ji Lab (33) Apply Ji Lab filter
- Johnson Lab (1) Apply Johnson Lab filter
- Karpova Lab (14) Apply Karpova Lab filter
- Keleman Lab (8) Apply Keleman Lab filter
- Keller Lab (61) Apply Keller Lab filter
- Koay Lab (4) Apply Koay Lab filter
- Lavis Lab (146) Apply Lavis Lab filter
- Lee (Albert) Lab (29) Apply Lee (Albert) Lab filter
- Leonardo Lab (19) Apply Leonardo Lab filter
- Li Lab (8) Apply Li Lab filter
- Lippincott-Schwartz Lab (108) Apply Lippincott-Schwartz Lab filter
- Liu (Yin) Lab (3) Apply Liu (Yin) Lab filter
- Liu (Zhe) Lab (60) Apply Liu (Zhe) Lab filter
- Looger Lab (137) Apply Looger Lab filter
- Magee Lab (31) Apply Magee Lab filter
- Menon Lab (12) Apply Menon Lab filter
- Murphy Lab (6) Apply Murphy Lab filter
- O'Shea Lab (7) Apply O'Shea Lab filter
- Otopalik Lab (1) Apply Otopalik Lab filter
- Pachitariu Lab (42) Apply Pachitariu Lab filter
- Pastalkova Lab (6) Apply Pastalkova Lab filter
- Pavlopoulos Lab (7) Apply Pavlopoulos Lab filter
- Pedram Lab (4) Apply Pedram Lab filter
- Podgorski Lab (16) Apply Podgorski Lab filter
- Reiser Lab (49) Apply Reiser Lab filter
- Riddiford Lab (20) Apply Riddiford Lab filter
- Romani Lab (39) Apply Romani Lab filter
- Rubin Lab (111) Apply Rubin Lab filter
- Saalfeld Lab (47) Apply Saalfeld Lab filter
- Satou Lab (3) Apply Satou Lab filter
- Scheffer Lab (38) Apply Scheffer Lab filter
- Schreiter Lab (53) Apply Schreiter Lab filter
- Schulze Lab (1) Apply Schulze Lab filter
- Sgro Lab (3) Apply Sgro Lab filter
- Shroff Lab (31) Apply Shroff Lab filter
- Simpson Lab (18) Apply Simpson Lab filter
- Singer Lab (37) Apply Singer Lab filter
- Spruston Lab (62) Apply Spruston Lab filter
- Stern Lab (77) Apply Stern Lab filter
- Sternson Lab (47) Apply Sternson Lab filter
- Stringer Lab (40) Apply Stringer Lab filter
- Svoboda Lab (132) Apply Svoboda Lab filter
- Tebo Lab (11) Apply Tebo Lab filter
- Tervo Lab (10) Apply Tervo Lab filter
- Tillberg Lab (19) Apply Tillberg Lab filter
- Tjian Lab (17) Apply Tjian Lab filter
- Truman Lab (58) Apply Truman Lab filter
- Turaga Lab (41) Apply Turaga Lab filter
- Turner Lab (27) Apply Turner Lab filter
- Vale Lab (8) Apply Vale Lab filter
- Voigts Lab (4) Apply Voigts Lab filter
- Wang (Meng) Lab (29) Apply Wang (Meng) Lab filter
- Wang (Shaohe) Lab (6) Apply Wang (Shaohe) Lab filter
- Wong-Campos Lab (1) Apply Wong-Campos Lab filter
- Wu Lab (8) Apply Wu Lab filter
- Zlatic Lab (26) Apply Zlatic Lab filter
- Zuker Lab (5) Apply Zuker Lab filter
Associated Project Team
- CellMap (13) Apply CellMap filter
- COSEM (3) Apply COSEM filter
- FIB-SEM Technology (5) Apply FIB-SEM Technology filter
- Fly Descending Interneuron (12) Apply Fly Descending Interneuron filter
- Fly Functional Connectome (14) Apply Fly Functional Connectome filter
- Fly Olympiad (5) Apply Fly Olympiad filter
- FlyEM (56) Apply FlyEM filter
- FlyLight (50) Apply FlyLight filter
- GENIE (47) Apply GENIE filter
- Integrative Imaging (9) Apply Integrative Imaging filter
- Larval Olympiad (2) Apply Larval Olympiad filter
- MouseLight (18) Apply MouseLight filter
- NeuroSeq (1) Apply NeuroSeq filter
- ThalamoSeq (1) Apply ThalamoSeq filter
- Tool Translation Team (T3) (29) Apply Tool Translation Team (T3) filter
- Transcription Imaging (45) Apply Transcription Imaging filter
Associated Support Team
- Project Pipeline Support (5) Apply Project Pipeline Support filter
- Anatomy and Histology (18) Apply Anatomy and Histology filter
- Cryo-Electron Microscopy (45) Apply Cryo-Electron Microscopy filter
- Electron Microscopy (18) Apply Electron Microscopy filter
- Gene Targeting and Transgenics (11) Apply Gene Targeting and Transgenics filter
- High Performance Computing (7) Apply High Performance Computing filter
- Integrative Imaging (23) Apply Integrative Imaging filter
- Invertebrate Shared Resource (40) Apply Invertebrate Shared Resource filter
- Janelia Experimental Technology (39) Apply Janelia Experimental Technology filter
- Management Team (1) Apply Management Team filter
- Mass Spectrometry (1) Apply Mass Spectrometry filter
- Molecular Genomics (15) Apply Molecular Genomics filter
- Project Technical Resources (54) Apply Project Technical Resources filter
- Quantitative Genomics (20) Apply Quantitative Genomics filter
- Scientific Computing (104) Apply Scientific Computing filter
- Stem Cell & Primary Culture (14) Apply Stem Cell & Primary Culture filter
- Viral Tools (14) Apply Viral Tools filter
- Vivarium (7) Apply Vivarium filter
Publication Date
- 2026 (74) Apply 2026 filter
- 2025 (222) Apply 2025 filter
- 2024 (209) Apply 2024 filter
- 2023 (157) Apply 2023 filter
- 2022 (166) Apply 2022 filter
- 2021 (175) Apply 2021 filter
- 2020 (177) Apply 2020 filter
- 2019 (177) Apply 2019 filter
- 2018 (206) Apply 2018 filter
- 2017 (186) Apply 2017 filter
- 2016 (191) Apply 2016 filter
- 2015 (195) Apply 2015 filter
- 2014 (190) Apply 2014 filter
- 2013 (136) Apply 2013 filter
- 2012 (112) Apply 2012 filter
- 2011 (98) Apply 2011 filter
- 2010 (61) Apply 2010 filter
- 2009 (56) Apply 2009 filter
- 2008 (40) Apply 2008 filter
- 2007 (21) Apply 2007 filter
- 2006 (3) Apply 2006 filter
2852 Janelia Publications
Showing 1271-1280 of 2852 resultsIn insects juvenile hormone (JH) regulates both metamorphosis and reproduction. This lecture focuses on our current understanding of JH action at the molecular level in both of these processes based primarily on studies in the tobacco hornworm Manduca sexta, the flour beetle Tribolium castaneum, the mosquito Aedes aegypti, and the fruit fly Drosophila melanogaster. The roles of the JH receptor complex and the transcription factors that it regulates during larval molting and metamorphosis are summarized. Also highlighted are the intriguing interactions of the JH and insulin signaling pathways in both imaginal disc development and vitellogenesis. Critical actions of JH and its receptor in the timing of maturation of the adult optic lobe and of female receptivity in Drosophila are also discussed.
The adaptive dynamics of evolving microbial populations takes place on a complex fitness landscape generated by epistatic interactions. The population generically consists of multiple competing strains, a phenomenon known as clonal interference. Microscopic epistasis and clonal interference are central aspects of evolution in microbes, but their combined effects on the functional form of the population’s mean fitness are poorly understood. Here, we develop a computational method that resolves the full microscopic complexity of an evolving population subject to a standard serial dilution protocol. We find that stronger microscopic epistasis gives rise to fitness trajectories with slower growth independent of the number of competing strains, which we quantify with power-law fits and understand mechanistically via a random walk model that neglects dynamical correlations between genes. We show that clonal interference leads to fitness trajectories with faster growth (in functional form) without microscopic epistasis, but has a negligible effect when epistasis is sufficiently strong, indicating that the role of clonal interference depends intimately on the underlying fitness landscape.
Reducing fibrous aggregates of protein tau is a possible strategy for halting progression of Alzheimer’s disease (AD). Previously we found that in vitro the D-peptide D-TLKIVWC fragments tau fibrils from AD brains (AD-tau) into benign segments, whereas its six-residue analog D-TLKIVW cannot. However, the underlying fragmentation mechanism remains unknown, preventing the further development of this type of drug candidate for AD. To understand the necessity of the cysteine residue of D-TLKIVWC in fragmenting AD-tau, we designed a series of peptides of sequence D-TLKIVWX varying only at the seventh residue, X. To better understand the fragmentation process of AD-tau, we conducted a time-course dot blot and EM experiment. We determined the structures of D-TLKIVWX amyloid-like fibrils by atomic force microscopy and cryo-electron microscopy. We studied the complexes of D-TLKIVWX (X = I, S, R) with AD-tau by cryo-electron microscopy and confirmed the binding site between D-TLKIVWX and Tau through NMR. These D-TLKIVWX candidates showed various efficacies in fragmenting AD-tau in vitro, in which X = Ile was the best performer. From electron microscopy, we discovered that D-TLKIVWX peptides form amyloid-like fibrils themselves, and from atomic force microscopy we learned that these fibrils have a right-handed helical twist, in contrast to the left-handed helical twist of AD-tau. From cryo-EM we learned that D-TLKIVWX protofilaments bind to tau fibrils of opposing twist. We find that the amyloid-like, fibril-forming property of D-TLKIVWX contributes to the fragmentation of AD-tau fibrils. We propose the strain-relief mechanism of fragmentation and believe the fragmentation of AD-tau fibrils is driven by the release of torsion in D-TLKIVWX protofilaments.Background
Method
Result
Conclusion
Reducing fibrous aggregates of the protein tau is a possible strategy for halting the progression of Alzheimer's disease (AD). Previously, we found that in vitro, the D-enantiomeric peptide (D-peptide) D-TLKIVWC disassembles ultra-stable tau fibrils extracted from the autopsied brains of individuals with AD (hereafter, these tau fibrils are referred to as AD-tau) into benign segments, with no energy source other than ambient thermal agitation. To consider D-peptide-mediated disassembly as a potential route to therapeutics for AD, it is essential to understand the mechanism and energy source of the disassembly action. Here, we show that the assembly of D-peptides into amyloid-like ('mock-amyloid') fibrils is essential for AD-tau disassembly. These mock-amyloid fibrils have a right-handed twist but are constrained to adopt a left-handed twist when templated in complex with AD-tau. The release of strain that accompanies the conversion of left-twisted to right-twisted, relaxed mock-amyloid produces a torque that is sufficient to break the local hydrogen bonding between tau molecules, and leads to the fragmentation of AD-tau. This strain-relief mechanism seems to operate in other examples of amyloid fibril disassembly, and could inform the development of first-in-class therapeutics for amyloid diseases.
Each faculty recruiting season, many postdocs ask, "What is a chalk talk?" The chalk talk is many things-a sales pitch, a teaching demonstration, a barrage of questions, and a description of a future research program. The chalk talk is arguably the most important component of a faculty search interview. Yet few postdocs or grad students receive training or practice in giving a chalk talk. In the following essay, I'll cover the basics of chalk talk design and preparation.
In the perception of color, wavelengths of light reflected off objects are transformed into the derived quantities of brightness, saturation and hue. Neurons responding selectively to hue have been reported in primate cortex, but it is unknown how their narrow tuning in color space is produced by upstream circuit mechanisms. We report the discovery of neurons in the Drosophila optic lobe with hue-selective properties, which enables circuit-level analysis of color processing. From our analysis of an electron microscopy volume of a whole Drosophila brain, we construct a connectomics-constrained circuit model that accounts for this hue selectivity. Our model predicts that recurrent connections in the circuit are critical for generating hue selectivity. Experiments using genetic manipulations to perturb recurrence in adult flies confirm this prediction. Our findings reveal a circuit basis for hue selectivity in color vision.
Physiological need states direct decision-making toward re-establishing homeostasis. Using a two-alternative forced choice task for mice that models elements of human decisions, we found that varying hunger and thirst states caused need-inappropriate choices, such as food seeking when thirsty. These results show limits on interoceptive knowledge of hunger and thirst states to guide decision-making. Instead, need states were identified after food and water consumption by outcome evaluation, which depended on the medial prefrontal cortex.
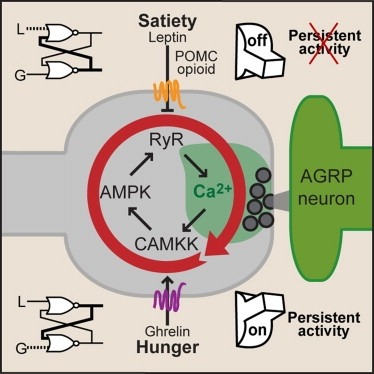
Synaptic plasticity in response to changes in physiologic state is coordinated by hormonal signals across multiple neuronal cell types. Here, we combine cell-type-specific electrophysiological, pharmacological, and optogenetic techniques to dissect neural circuits and molecular pathways controlling synaptic plasticity onto AGRP neurons, a population that regulates feeding. We find that food deprivation elevates excitatory synaptic input, which is mediated by a presynaptic positive feedback loop involving AMP-activated protein kinase. Potentiation of glutamate release was triggered by the orexigenic hormone ghrelin and exhibited hysteresis, persisting for hours after ghrelin removal. Persistent activity was reversed by the anorexigenic hormone leptin, and optogenetic photostimulation demonstrated involvement of opioid release from POMC neurons. Based on these experiments, we propose a memory storage device for physiological state constructed from bistable synapses that are flipped between two sustained activity states by transient exposure to hormones signaling energy levels.