Filter
Associated Lab
- Aguilera Castrejon Lab (4) Apply Aguilera Castrejon Lab filter
- Ahrens Lab (64) Apply Ahrens Lab filter
- Aso Lab (42) Apply Aso Lab filter
- Baker Lab (19) Apply Baker Lab filter
- Betzig Lab (104) Apply Betzig Lab filter
- Beyene Lab (10) Apply Beyene Lab filter
- Bock Lab (14) Apply Bock Lab filter
- Branson Lab (53) Apply Branson Lab filter
- Card Lab (37) Apply Card Lab filter
- Cardona Lab (45) Apply Cardona Lab filter
- Chklovskii Lab (10) Apply Chklovskii Lab filter
- Clapham Lab (15) Apply Clapham Lab filter
- Cui Lab (19) Apply Cui Lab filter
- Darshan Lab (8) Apply Darshan Lab filter
- Dennis Lab (2) Apply Dennis Lab filter
- Dickson Lab (32) Apply Dickson Lab filter
- Druckmann Lab (21) Apply Druckmann Lab filter
- Dudman Lab (46) Apply Dudman Lab filter
- Eddy/Rivas Lab (30) Apply Eddy/Rivas Lab filter
- Egnor Lab (4) Apply Egnor Lab filter
- Espinosa Medina Lab (21) Apply Espinosa Medina Lab filter
- Feliciano Lab (16) Apply Feliciano Lab filter
- Fetter Lab (31) Apply Fetter Lab filter
- FIB-SEM Technology (1) Apply FIB-SEM Technology filter
- Fitzgerald Lab (17) Apply Fitzgerald Lab filter
- Freeman Lab (15) Apply Freeman Lab filter
- Funke Lab (46) Apply Funke Lab filter
- Gonen Lab (59) Apply Gonen Lab filter
- Grigorieff Lab (34) Apply Grigorieff Lab filter
- Harris Lab (55) Apply Harris Lab filter
- Heberlein Lab (13) Apply Heberlein Lab filter
- Hermundstad Lab (28) Apply Hermundstad Lab filter
- Hess Lab (77) Apply Hess Lab filter
- Ilanges Lab (4) Apply Ilanges Lab filter
- Jayaraman Lab (45) Apply Jayaraman Lab filter
- Ji Lab (33) Apply Ji Lab filter
- Johnson Lab (2) Apply Johnson Lab filter
- Karpova Lab (14) Apply Karpova Lab filter
- Keleman Lab (8) Apply Keleman Lab filter
- Keller Lab (62) Apply Keller Lab filter
- Koay Lab (4) Apply Koay Lab filter
- Lavis Lab (150) Apply Lavis Lab filter
- Lee (Albert) Lab (29) Apply Lee (Albert) Lab filter
- Leonardo Lab (19) Apply Leonardo Lab filter
- Li Lab (8) Apply Li Lab filter
- Lippincott-Schwartz Lab (110) Apply Lippincott-Schwartz Lab filter
- Liu (Yin) Lab (4) Apply Liu (Yin) Lab filter
- Liu (Zhe) Lab (60) Apply Liu (Zhe) Lab filter
- Looger Lab (137) Apply Looger Lab filter
- Magee Lab (31) Apply Magee Lab filter
- Menon Lab (12) Apply Menon Lab filter
- Murphy Lab (6) Apply Murphy Lab filter
- O'Shea Lab (7) Apply O'Shea Lab filter
- Otopalik Lab (1) Apply Otopalik Lab filter
- Pachitariu Lab (44) Apply Pachitariu Lab filter
- Pastalkova Lab (6) Apply Pastalkova Lab filter
- Pavlopoulos Lab (7) Apply Pavlopoulos Lab filter
- Pedram Lab (4) Apply Pedram Lab filter
- Podgorski Lab (16) Apply Podgorski Lab filter
- Reiser Lab (49) Apply Reiser Lab filter
- Riddiford Lab (20) Apply Riddiford Lab filter
- Romani Lab (40) Apply Romani Lab filter
- Rubin Lab (111) Apply Rubin Lab filter
- Saalfeld Lab (49) Apply Saalfeld Lab filter
- Satou Lab (3) Apply Satou Lab filter
- Scheffer Lab (38) Apply Scheffer Lab filter
- Schreiter Lab (55) Apply Schreiter Lab filter
- Schulze Lab (1) Apply Schulze Lab filter
- Sgro Lab (3) Apply Sgro Lab filter
- Shroff Lab (35) Apply Shroff Lab filter
- Simpson Lab (18) Apply Simpson Lab filter
- Singer Lab (37) Apply Singer Lab filter
- Spruston Lab (62) Apply Spruston Lab filter
- Stern Lab (77) Apply Stern Lab filter
- Sternson Lab (47) Apply Sternson Lab filter
- Stringer Lab (41) Apply Stringer Lab filter
- Svoboda Lab (132) Apply Svoboda Lab filter
- Tebo Lab (12) Apply Tebo Lab filter
- Tervo Lab (10) Apply Tervo Lab filter
- Tillberg Lab (19) Apply Tillberg Lab filter
- Tjian Lab (17) Apply Tjian Lab filter
- Truman Lab (58) Apply Truman Lab filter
- Turaga Lab (41) Apply Turaga Lab filter
- Turner Lab (27) Apply Turner Lab filter
- Vale Lab (8) Apply Vale Lab filter
- Voigts Lab (5) Apply Voigts Lab filter
- Wang (Meng) Lab (31) Apply Wang (Meng) Lab filter
- Wang (Shaohe) Lab (6) Apply Wang (Shaohe) Lab filter
- Wong-Campos Lab (1) Apply Wong-Campos Lab filter
- Wu Lab (8) Apply Wu Lab filter
- Zlatic Lab (26) Apply Zlatic Lab filter
- Zuker Lab (5) Apply Zuker Lab filter
Associated Project Team
- CellMap (13) Apply CellMap filter
- COSEM (3) Apply COSEM filter
- FIB-SEM Technology (5) Apply FIB-SEM Technology filter
- Fly Descending Interneuron (12) Apply Fly Descending Interneuron filter
- Fly Functional Connectome (14) Apply Fly Functional Connectome filter
- Fly Olympiad (5) Apply Fly Olympiad filter
- FlyEM (56) Apply FlyEM filter
- FlyLight (50) Apply FlyLight filter
- GENIE (47) Apply GENIE filter
- Integrative Imaging (11) Apply Integrative Imaging filter
- Larval Olympiad (2) Apply Larval Olympiad filter
- MouseLight (18) Apply MouseLight filter
- NeuroSeq (1) Apply NeuroSeq filter
- ThalamoSeq (1) Apply ThalamoSeq filter
- Tool Translation Team (T3) (29) Apply Tool Translation Team (T3) filter
- Transcription Imaging (45) Apply Transcription Imaging filter
Associated Support Team
- Project Pipeline Support (5) Apply Project Pipeline Support filter
- Anatomy and Histology (18) Apply Anatomy and Histology filter
- Cryo-Electron Microscopy (49) Apply Cryo-Electron Microscopy filter
- Electron Microscopy (18) Apply Electron Microscopy filter
- Gene Targeting and Transgenics (11) Apply Gene Targeting and Transgenics filter
- High Performance Computing (7) Apply High Performance Computing filter
- Integrative Imaging (25) Apply Integrative Imaging filter
- Invertebrate Shared Resource (40) Apply Invertebrate Shared Resource filter
- Janelia Experimental Technology (40) Apply Janelia Experimental Technology filter
- Management Team (1) Apply Management Team filter
- Mass Spectrometry (1) Apply Mass Spectrometry filter
- Molecular Genomics (15) Apply Molecular Genomics filter
- Project Technical Resources (54) Apply Project Technical Resources filter
- Quantitative Genomics (20) Apply Quantitative Genomics filter
- Scientific Computing (106) Apply Scientific Computing filter
- Stem Cell & Primary Culture (14) Apply Stem Cell & Primary Culture filter
- Viral Tools (14) Apply Viral Tools filter
- Vivarium (7) Apply Vivarium filter
Publication Date
- 2026 (118) Apply 2026 filter
- 2025 (223) Apply 2025 filter
- 2024 (208) Apply 2024 filter
- 2023 (157) Apply 2023 filter
- 2022 (166) Apply 2022 filter
- 2021 (175) Apply 2021 filter
- 2020 (177) Apply 2020 filter
- 2019 (177) Apply 2019 filter
- 2018 (206) Apply 2018 filter
- 2017 (186) Apply 2017 filter
- 2016 (191) Apply 2016 filter
- 2015 (195) Apply 2015 filter
- 2014 (190) Apply 2014 filter
- 2013 (136) Apply 2013 filter
- 2012 (112) Apply 2012 filter
- 2011 (98) Apply 2011 filter
- 2010 (61) Apply 2010 filter
- 2009 (56) Apply 2009 filter
- 2008 (40) Apply 2008 filter
- 2007 (21) Apply 2007 filter
- 2006 (3) Apply 2006 filter
2896 Janelia Publications
Showing 321-330 of 2896 resultsKainic acid-induced status epilepticus (KA-SE) in mature rats results in the development of spontaneous recurrent seizures and a pattern of cell death resembling hippocampal sclerosis in patients with temporal lobe epilepsy. In contrast, KA-SE in young animals before postnatal day (P) 18 is less likely to cause cell death or epilepsy. To investigate whether changes in neuronal excitability occur in the subiculum after KA-SE, we examined the age-dependent effects of SE on the bursting neurons of subiculum, the major output region of the hippocampus. Patch-clamp recordings were used to monitor bursting in pyramidal neurons in the subiculum of rat hippocampal slices. Neurons were studied either one or 2-3 weeks following injection of KA or saline (control) in immature (P15) or more mature (P30) rats, which differ in their sensitivity to KA as well as the long-term sequelae of the KA-SE. A significantly greater proportion of subicular pyramidal neurons from P15 rats were strong-bursting neurons and showed increased frequency-dependent bursting compared to P30 animals. Frequency-dependent burst firing was enhanced in P30, but not in P15 rats following KA-SE. The enhancement of bursting induced by KA-SE in more mature rats suggests that the frequency-dependent limitation of repetitive burst firing, which normally occurs in the subiculum, is compromised following SE. These changes could facilitate the initiation of spontaneous recurrent seizures or their spread from the hippocampus to other parts of the brain.
Often referred to as a 'fight,' survival involves intense competition over resources. Threat displays and high-intensity attacks are just a few of the aggressive actions exhibited during these contests. Certain motor programs are species-specific, like the vibration of a rattlesnake tail. However, conserved behavioral features are found across species, which appear to be mirrored within the brain. Further parallels have been found across sexes between aggression-promoting contexts and the underlying neuronal circuits. Unraveling the complex web of conserved and variable circuit mechanisms has been considerably advanced by the generation of brain-wiring diagrams in adult female and male Drosophila melanogaster. Here, I will summarize current research, primarily in Drosophila, on how contexts, sensory cues, and internal states regulate aggression across sexes.
Organismal aging involves functional declines in both somatic and reproductive tissues. Multiple strategies have been discovered to extend lifespan across species. However, how age-related molecular changes differ among various tissues and how those lifespan-extending strategies slow tissue aging in distinct manners remain unclear. Here we generated the transcriptomic Cell Atlas of Worm Aging (CAWA, http://mengwanglab.org/atlas ) of wild-type and long-lived strains. We discovered cell-specific, age-related molecular and functional signatures across all somatic and germ cell types. We developed transcriptomic aging clocks for different tissues and quantitatively determined how three different pro-longevity strategies slow tissue aging distinctively. Furthermore, through genome-wide profiling of alternative polyadenylation (APA) events in different tissues, we discovered cell-type-specific APA changes during aging and revealed how these changes are differentially affected by the pro-longevity strategies. Together, this study offers fundamental molecular insights into both somatic and reproductive aging and provides a valuable resource for in-depth understanding of the diversity of pro-longevity mechanisms.
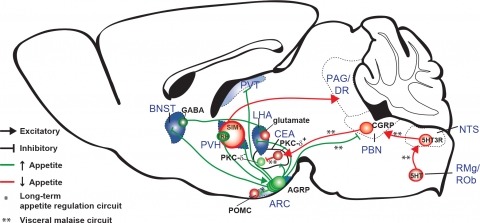
New tools for mapping and manipulating molecularly defined neural circuits have improved understanding of how the central nervous system regulates appetite. Studies focused on AGRP neurons, a starvation-sensitive hypothalamic population, have identified multiple circuit elements that can elicit or suppress feeding behavior. Distinct axon projections of this neuron population point to different circuits that regulate long-term appetite, short-term feeding, or visceral malaise-mediated anorexia. Here, we review recent studies examining these neural circuits that control food intake. © 2014 S. Karger AG, Basel.
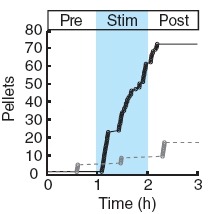
Two intermingled hypothalamic neuron populations specified by expression of agouti-related peptide (AGRP) or pro-opiomelanocortin (POMC) positively and negatively influence feeding behavior, respectively, possibly by reciprocally regulating downstream melanocortin receptors. However, the sufficiency of these neurons to control behavior and the relationship of their activity to the magnitude and dynamics of feeding are unknown. To measure this, we used channelrhodopsin-2 for cell type-specific photostimulation. Activation of only 800 AGRP neurons in mice evoked voracious feeding within minutes. The behavioral response increased with photoexcitable neuron number, photostimulation frequency and stimulus duration. Conversely, POMC neuron stimulation reduced food intake and body weight, which required melanocortin receptor signaling. However, AGRP neuron-mediated feeding was not dependent on suppressing this melanocortin pathway, indicating that AGRP neurons directly engage feeding circuits. Furthermore, feeding was evoked selectively over drinking without training or prior photostimulus exposure, which suggests that AGRP neurons serve a dedicated role coordinating this complex behavior.
To thrive, organisms must maintain physiological and environmental variables in suitable ranges. Given that these variables undergo constant fluctuations over varying time scales, how do biological control systems maintain control over these values? We explored this question in the context of phototactic behavior in larval zebrafish. We demonstrate that larval zebrafish use phototaxis to maintain environmental luminance at a set point, that the value of this set point fluctuates on a time scale of seconds when environmental luminance changes, and that it is determined by calculating the mean input across both sides of the visual field. These results expand on previous studies of flexible phototaxis in larval zebrafish; they suggest that larval zebrafish exert homeostatic control over the luminance of their surroundings, and that feedback from the surroundings drives allostatic changes to the luminance set point. As such, we describe a novel behavioral algorithm with which larval zebrafish exert control over a sensory variable.
The calcium-modulated photoactivatable ratiometric integrator CaMPARI (Fosque et al., 2015) facilitates the study of neural circuits by permanently marking cells active during user-specified temporal windows. Permanent marking enables measurement of signals from large swathes of tissue and easy correlation of activity with other structural or functional labels. One potential application of CaMPARI is labeling neurons postsynaptic to specific populations targeted for optogenetic stimulation, giving rise to all-optical functional connectivity mapping. Here, we characterized the response of CaMPARI to several common types of neuronal calcium signals in mouse acute cortical brain slices. Our experiments show that CaMPARI is effectively converted by both action potentials and sub-threshold synaptic inputs, and that conversion level is correlated to synaptic strength. Importantly, we found that conversion rate can be tuned: it is linearly related to light intensity. At low photoconversion light levels CaMPARI offers a wide dynamic range due to slower conversion rate; at high light levels conversion is more rapid and more sensitive to activity. Finally, we employed CaMPARI and optogenetics for functional circuit mapping in ex vivo acute brain slices, which preserve in vivo-like connectivity of axon terminals. With a single light source, we stimulated channelrhodopsin-2-expressing long-range posteromedial (POm) thalamic axon terminals in cortex and induced CaMPARI conversion in recipient cortical neurons. We found that POm stimulation triggers robust photoconversion of layer 5 cortical neurons and weaker conversion of layer 2/3 neurons. Thus, CaMPARI enables network-wide, tunable, all-optical functional circuit mapping that captures supra- and sub-threshold depolarization. This article is protected by copyright. All rights reserved.
Ionic driving forces provide the net electromotive force for ion movement across membranes and are therefore a fundamental property of all cells. In the nervous system, chloride driving force (DFCl) determines inhibitory signaling, as fast synaptic inhibition is mediated by chloride-permeable GABAA and glycine receptors. Here we present a new tool for all-Optical Reporting of CHloride Ion Driving force (ORCHID). We demonstrate ORCHID’s ability to provide accurate, high-throughput measurements of resting and dynamic DFCl from genetically targeted cell types over a range of timescales. ORCHID confirms theoretical predictions about the biophysical mechanisms that establish DFCl, reveals novel differences in DFCl between neurons and astrocytes under different network conditions, and affords the first in vivo measurements of intact DFCl in mouse cortical neurons. This work extends our understanding of chloride homeostasis and inhibitory synaptic transmission and establishes a precedent for utilizing all-optical methods to assess ionic driving force.
Ionic driving forces provide the net electromotive force for ion movement across receptors, channels, and transporters, and are a fundamental property of all cells. In the nervous system, fast synaptic inhibition is mediated by chloride permeable GABA and glycine receptors, and single-cell intracellular recordings have been the only method for estimating driving forces across these receptors (DF). Here we present a tool for quantifying inhibitory receptor driving force named ORCHID: all-Optical Reporting of CHloride Ion Driving force. We demonstrate ORCHID's ability to provide accurate, high-throughput measurements of resting and dynamic DF from genetically targeted cell types over multiple timescales. ORCHID confirms theoretical predictions about the biophysical mechanisms that establish DF, reveals differences in DF between neurons and astrocytes, and affords the first in vivo measurements of intact DF. This work extends our understanding of inhibitory synaptic transmission and demonstrates the potential for all-optical methods to assess ionic driving forces.
Ionic driving forces provide the net electromotive force for ion movement across receptors, channels, and transporters, and are a fundamental property of all cells. In the brain for example, fast synaptic inhibition is mediated by chloride permeable GABAA receptors, and single-cell intracellular recordings have been the only method for estimating driving forces across these receptors (DFGABAA). Here we present a new tool for quantifying inhibitory receptor driving force named ORCHID: all-Optical Reporting of CHloride Ion Driving force. We demonstrate ORCHID’s ability to provide accurate, high-throughput measurements of resting and dynamic DFGABAA from genetically targeted cell types over multiple timescales. ORCHID confirms theoretical predictions about the biophysical mechanisms that establish DFGABAA, reveals novel differences in DFGABAA between neurons and astrocytes, and affords the first in vivo measurements of intact DFGABAA. This work extends our understanding of inhibitory synaptic transmission and establishes a precedent for all-optical methods to assess ionic driving forces.